Picture (above): The R V Investigator on the high seas. Credit: CSIRO Science Images.
by Rob Warren
Between December 23, 2019, and January 2, 2020, the RV Investigator – CSIRO’s $120 million state-of-the-art marine research vessel – sailed from Darwin to Fremantle along the remote northwest coast of Australia… and I was lucky enough to be on board.
This was the last of three transit voyages made in 2019. The first was from Hobart to Fremantle in May while the second journeyed from Brisbane to Darwin in October. The main purpose of these voyages is simply to get the ship from one field campaign base to the next; however, science teams can apply for berths, and limited additional sea-time to conduct research during the transit.
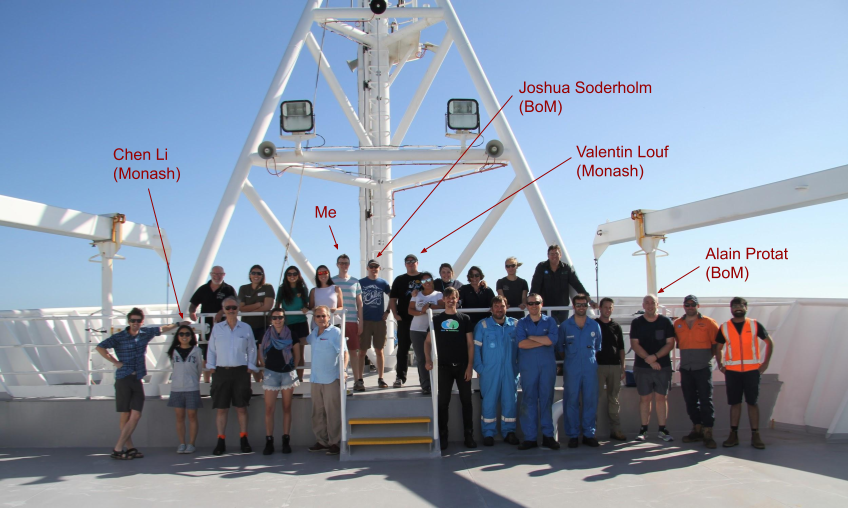
I was part of a team of five atmospheric scientists (above), led by Alain Protat from the Bureau of Meteorology (BoM), working on a project called ORCA (more on this shortly). We were joined by two other science teams: one led by Sophie Leterme from Flinders University, looking at microplastics in the food chain, the other led by Eric Woehler from the University of Tasmania, looking at the distribution and abundance of seabirds. Together with the ship’s crew, various support staff, two STEM teachers (under the Educator on Board program), two students (recipients of the Indigenous Time at Sea Scholarship), and voyage manager Matt Boyd, 49 people made the epic 10-day, 3,600 km journey.
Back to our ORCA project. ORCA stands for “Optimizing Radar Calibration and Attenuation corrections”. The main goal of the radar team on the voyage was to use the Investigator’s onboard polarimetric research radar, OceanPol, as a reference to calibrate the operational weather radars dotted along the coast of Western Australia. Previous work (led by yours truly) showed that miscalibration (under- or over-reading) is a major issue affecting the Australian radar network. This has serious implications for our ability to monitor and predict thunderstorms and associated hazards, such as heavy rain, hail, and damaging winds. As a result of this work, routine comparisons are now made between all operational radars and the precipitation radar onboard NASA’s GPM (Global Precipitation Measurement) satellite. However, these comparisons are subject to significant uncertainty, due to the vastly different sampling characteristics of the ground-based and spaceborne instruments.
In contrast, OceanPol essentially performs sampling in the same way as the operational radars, making intercomparisons significantly less complex and therefore subject to reduced uncertainty. One issue common to both approaches, however, is the need for precipitation within the radars’ field of view. As anyone familiar with Australia’s climate knows, precipitation can be a fickle thing. Our chances of encountering rain were pretty good during the first part of the voyage, as we traversed the tropical north coast of WA, but gradually diminished as we moved south into the desert climate of the subtropics. Fortunately, the absence of rain didn’t have to mean the absence of good science. Measurements of ground clutter (trees, buildings, etc.) and the position of the sun provide additional useful information for monitoring the calibration and pointing accuracy of a radar. Dedicated “raster scans” of the sun were performed at regular intervals throughout the voyage, while ground clutter was observed at each of the operational radar sites.

Precipitation was ultimately observed at four of the seven coastal radars: Broome, Port Hedland, Dampier, and Learmonth. However, at this stage, only data from Broome have been analysed. Comparisons with GPM, performed during the 2018/19 wet season, indicated a substantial bias of around −7.5 dB at this site. However, the comparisons with OceanPol suggest a much smaller (but still significant) error of −2.5 dB (Fig. 2).
Assuming Broome’s calibration has not changed since the last wet season, this implies OceanPol itself is miscalibrated by −5 dB. Comparisons between OceanPol and GPM are currently being performed to further explore this possibility.
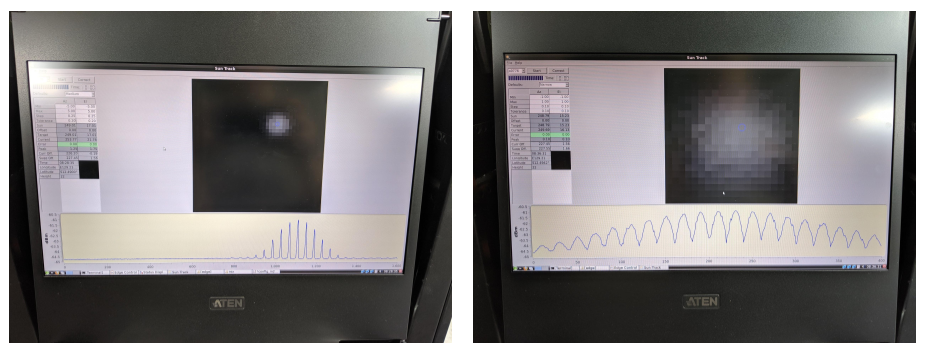
A raster scan of the sun, performed on the first day of the voyage, also revealed significant errors in the pointing angle of OceanPol: 1.25° in azimuth (too clockwise) and 1.75° in elevation (too high) (Fig. 3, left). The elevation error is particularly relevant as it means that at long-range the radar beam is measuring several kilometers higher than it should be. These errors were subsequently corrected (Fig. 3, right); however, they will need to be accounted for in the analysis of data from the Year of the Maritime Continent (YMC) field campaign, which preceded the transit voyage.
A late addition to our science plan was to launch radiosondes offshore of the Kimberley. Reanalysis products suggest this region is a global hotspot of Convective Available Potential Energy (CAPE), which is a measure of the amount of energy available for the formation of thunderstorms (large CAPE favours stronger storms). A related observation is that the Kimberley experiences the highest lightning frequencies in all of Oceania, with some locations recording over 50 lightning flashes per square kilometer each year.
Due to the low population density in this region (only three towns—Broome, Derby, and Kununurra—have a population over 2000), observations over land are very limited, while those over the ocean are practically non-existent. The ORCA voyage represented a rare opportunity to sample this unique and under-observed corner of the atmosphere.
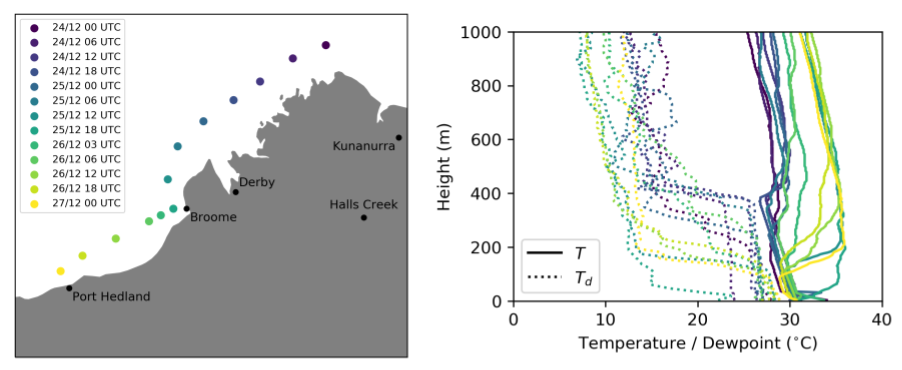
Radiosondes were launched every 6 hours during a three-day period starting at 00 UTC on December 24 (Fig. 4, left). The actual launch times were set 45 minutes ahead of the hour to allow complete vertical profiles of the troposphere to be assimilated into global numerical weather prediction models all around the world.
Analysis of the resulting profiles revealed the presence of significant CAPE in all cases, with maximum values of almost 8000 J/kg. However, many soundings (particularly those taken later in the sampling period) also featured large amounts (up to 350 J/kg) of convective inhibition (CIN), which is a measure of the energy required for rising air to realise its CAPE (large CIN acts to suppress storm formation).
These characteristics were associated with the presence of two distinct layers in the lower atmosphere: a moist maritime boundary layer topped by a warmer and significantly drier desert airmass. As we travelled southwest, the moist layer became progressively shallower, while the dry layer became progressively drier (Fig. 4, right), making the environment less and less favourable for storm formation. Further investigation of the processes leading to the formation of these airmass layers will likely form one component of an Honours project that I will be supervising this year.
The absolute highlight of the voyage (at least for us weather nerds) was what we dubbed the Christmas Day Storm. On the evening of December 25, while heading south on the approach to Broome, we intercepted a storm complex moving off the Kimberley coast. This system had rapidly developed east of Derby earlier in the day and, from there, propagated with the background easterly flow towards Broome (see Fig. 4 for locations).
We first became aware of the storm when it appeared on the Broome radar, but did not make visual contact with it until around sunset. As night fell we started to see flashes of lightning on the horizon. These grew clearer and more frequent as the system approached.
By this stage, the radar team (minus Alain) had assembled on the level 4 viewing deck, just below the bridge. As the leading edge of the storm passed overhead, we experienced two successive increases in wind speed: first to around 30 knots (~56 kph), and then to almost 50 knots (~93 kph) approximately 10 minutes later. At this point, safety considerations forced us to head back inside. However, we continued to watch the lightning display from the bridge for several hours, as the storm gradually dissipated.
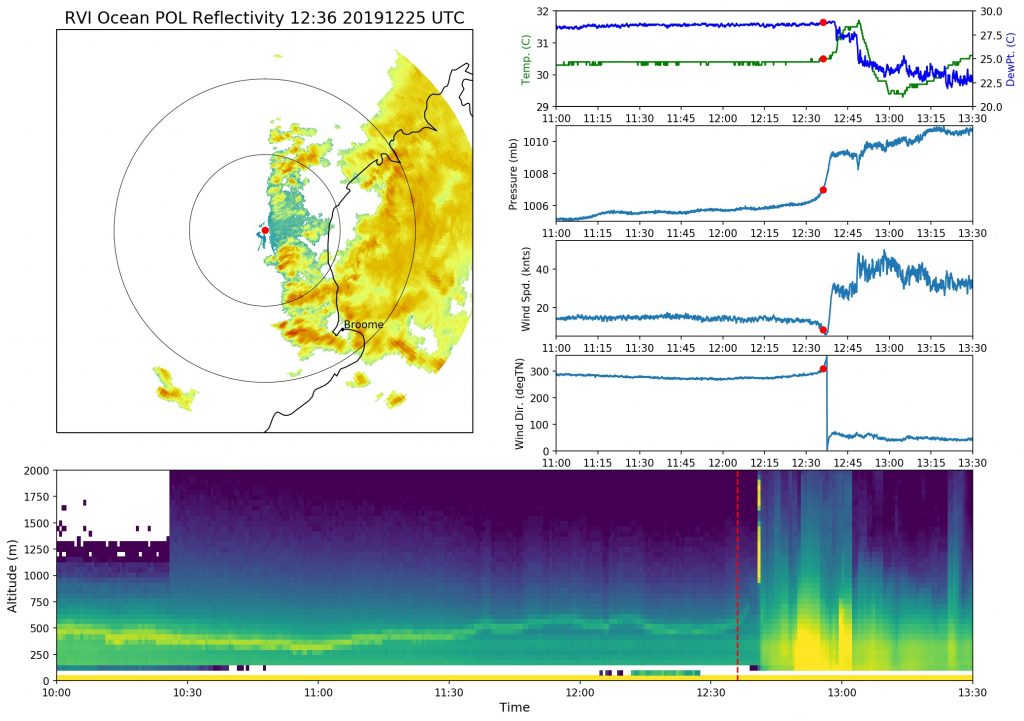
The following day, we looked at observations of this event from the Investigator’s various meteorological instruments (Fig. 5). Data from the onboard weather station (located on the ship’s mast) highlighted the distinct characteristics of the two wind changes.
The first, at around 12:35 UTC (20:35 local time), was accompanied by a rapid rise in pressure (~4 hPa) and temperature (~1°C), a drop in dewpoint temperature (~1°C), and a shift in wind direction from northwesterly to northeasterly.
The second saw a more significant drop in dewpoint (~3°C) and was followed by a more gradual decrease in temperature (~2°C in 10 minutes). Lidar observations revealed a rapid increase in boundary layer depth concurrent with the first wind change, as well as several wave-like features along the boundary layer top ahead of the storm. Based on this preliminary analysis, we concluded that the first wind change was associated with a bore-like wave, while the second represented the storm’s gust front (the leading edge of evaporatively cooled air spreading out from under the storm). Although bores (and associated cloud lines) are common features over northwest Australia, we believe that the unique set of observations obtained during this event would make it an interesting case for further study.
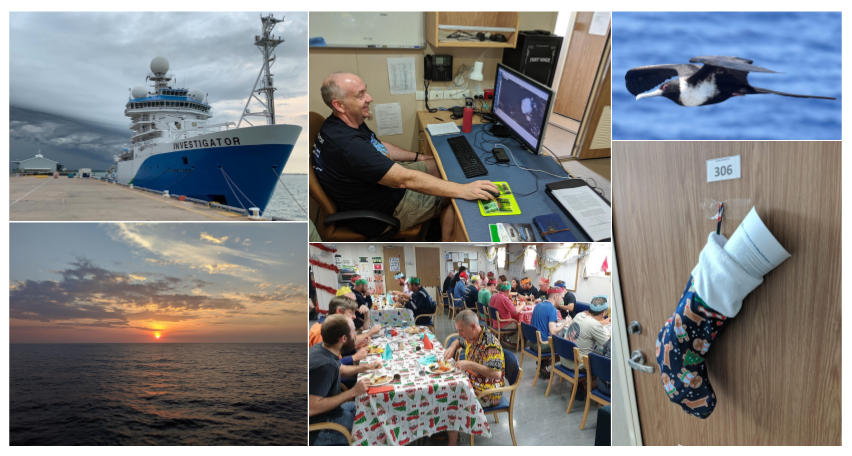
There were numerous other highlights during the voyage (Fig. 6), including a tour of the engine room, a demonstration of the ship’s bathymetry mapping systems, and a diverse mix of interesting presentations from different science groups.
Much to my surprise, the food onboard, prepared by chefs Keith and Kane, was consistently excellent, with an incredible Christmas Day seafood buffet that would put even the most festive Aussie family to shame. We also played a lot of ping pong (Alain is a pro), saw some unique wildlife (flying fish!), and witnessed a number of spectacular sunsets (though, sadly, no green flash).
While I can’t deny that, at the end of it all, I was happy to be back on dry land (and to sleep in a bed that wasn’t constantly moving), this was an experience that I will never forget. I am extremely grateful to CLEX, and my supervisor Christian Jakob, for supporting my participation.
