Written by Laure Poncet
Researchers at the ARC Centre of Excellence for Climate Extremes have investigated how ocean fronts have changed over the past two decades in parts of the ocean that are warming faster than others.
This research, recently published in Communications Earth & Environment, used satellite observations to study changes in frontal activity within these regions known as oceanic hotspots as well as the potential societal impacts associated with these changes.
By choosing oceanic hotspots as study regions, this research provides valuable insights about potential changes to other parts of the ocean within the broader context of climate change and ongoing warming of our oceans.
The study was initiated by Kai Yang as part of his PhD at the University of Tasmania and was co-authored by Amelie Meyer, Pete Strutton and Andy Fischer.
What are ocean fronts?
Fronts are boundaries that separate ocean water masses with different physical and biogeochemical properties like salinity, temperature, nutrients, and biomass. They can be as narrow as a few metres and as wide as several tens of kilometres and can be easily identified in satellite sea surface temperature and other satellite observations (Figure 1).
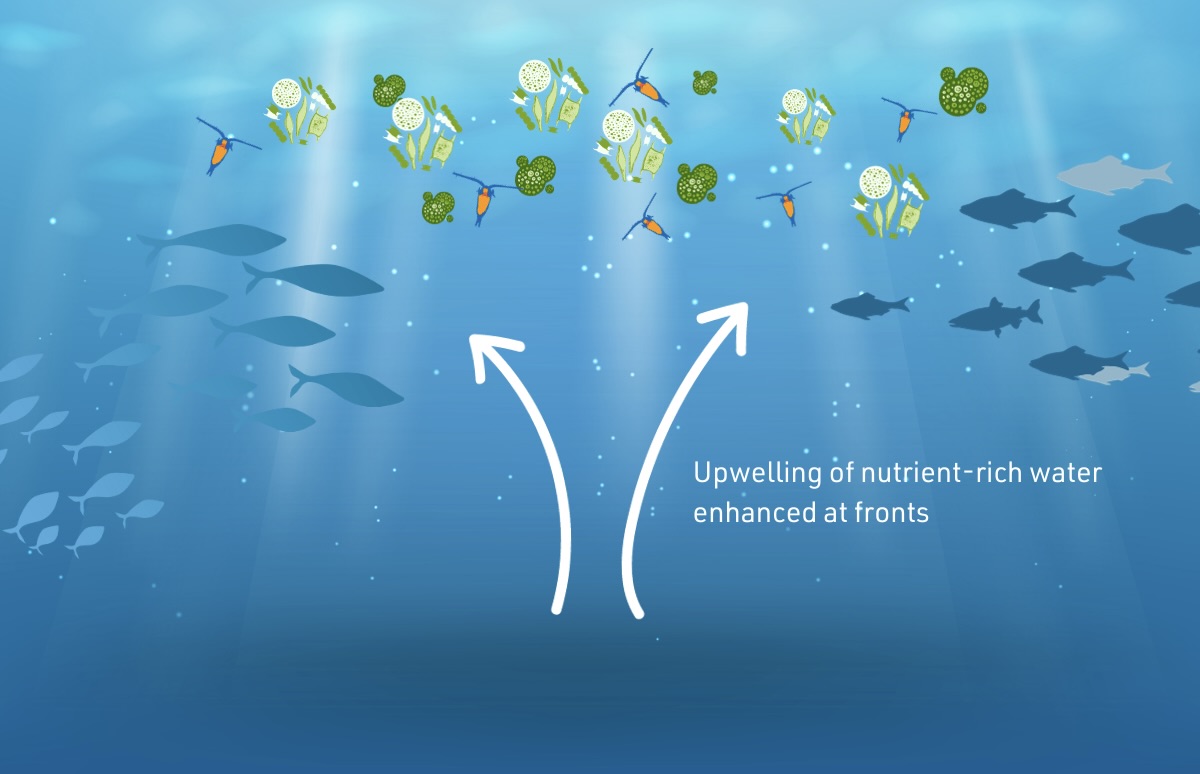
Fronts are among oceans’ most ecologically important structures. Many fronts facilitate the vertical movement of nutrient-rich water from the deep ocean to the surface, a process known as upwelling. This enhances the growth of microscopic algae called phytoplankton, which form the bases of marine food webs (Figure 2). These algae are eaten by primary consumers like zooplankton, small fishes, and crustaceans, which in turn are consumed by larger animals such as fish, turtles, and birds. The latter are consumed by ocean predators such as sharks and seals, which sit at the top of the marine food webs.

Hence, by enhancing the upwelling process, many fronts not only influence the distribution of phytoplankton but also the distribution of various marine species. Studies have shown, for example, that predators such as the southern elephant seals in the Southern Ocean, blue sharks in the Gulf Stream and loggerhead sea turtles in the southwestern Atlantic can track fronts as part of their foraging strategies. Changes in frontal activity can therefore impact marine ecosystems and have far-reaching implications for global fisheries.
“Ocean fronts play a very important role in marine ecosystems, impacting phytoplankton and the entire food web, from the smallest creatures to the biggest.”
— Kai Yang, PhD student at the University of Tasmania and lead author of the study
Observed changes in frontal activity in oceanic hotspots
Researchers used satellite records to investigate changes in frontal activity and chlorophyll concentration – an indicator for phytoplankton biomass – across 20 oceanic hotspots over the past two decades (2003-2020).
Oceanic hotspots are regions that are warming faster than other areas of the ocean – in this study, they experienced a warming of 0.1 to 0.8 degrees Celsius per decade. These hotspots were categorised into equatorial, subtropical gyre, boundary currents and high latitude hotspots (Figure 3).

Researchers observed a decrease in both frontal activity and chlorophyll concentration in most equatorial and subtropical gyre hotspots. In these regions, ocean warming led to fewer and weaker fronts, potentially due to increased stratification of the ocean – a strong stratification of the ocean makes it more difficult for deep water masses to mix with surface waters. This would reduce the upwelling of nutrients to the surface, in turn leading to a decrease in phytoplankton biomass.
In contrast, most high latitude hotspots showed increasing trends in frontal activity and chlorophyll concentration. The reasons behind these increases remain unclear and could potentially be attributed to change in sea ice dynamics in response to ocean warming.
Finally, boundary current hotspots showed mixed results, with frontal activity increasing in some and decreasing in others. Increasing trends were observed for the Southern Brazil Uruguay – S and Mozambique Channel hotspots, while decreasing trends were observed for the two hotspots near Australia. However, uncertainties remain regarding these results, as not all results were statistically significant.
“Our findings show that ocean warming has changed the behaviour of oceans fronts, with frontal activity decreasing in lower latitudes and increasing close to the Arctic.”
— Amelie Meyer, Chief Investigator at the ARC Centre of Excellence for Climate Extremes
What are the potential socio-economic impacts of these changes?
The equatorial and subtropical gyre hotspots are important regions for fisheries, contributing to a total annual catch of around 5 million tonnes of fish. These catches serve as a major source of food for human populations in the tropics and subtropics. The observed decrease in frontal activity and phytoplankton in these hotspots could lead to a decline in fish catch, posing significant challenges to local population.
On the other hand, an increase in frontal activity in high-latitudes hotspots may enhance fish catches in those regions, which already amount to 3 million tonnes per year.
Fish catches in boundary current hotspots are comparatively small – 0.2 million tonnes annually. However, they are important locally. For example, the Southeast Australia hotspot includes important species groups such as tuna, billfish, scalefish, and shark. In 2020-2021, the Australia Eastern Tuna and Billfish Fishery, one of the largest Australian fisheries accounted for 10% of total Commonwealth fishery production value. Given the potential socio-economic impacts of changes in frontal activity in those regions and the uncertainties of the observed trends, further research is needed.
“Chlorophyll patterns mirror changes in frontal activity, raising our concerns about changes in ocean productivity, vital for numerous communities that rely on fisheries.”
— Kai Yang, lead author of the study
What can this study tell us about future trends in frontal activity?
Oceans take up more than 90% of the excess heat in the climate system. With climate change, they will continue to warm. By choosing ocean warming hotspots as study regions, this research provides valuable insights into future trends in frontal activity in other parts of the ocean.
Equatorial and subtropical surface oceans may experience a decline in frontal activity and become poorer in phytoplankton in the future. In contrast, high-latitudes regions could become more productive through an increase in frontal activity and nutrient fluxes.
While this study provides an important basis for discussion, uncertainties remain around future changes in frontal activity. Given the implications for fisheries landings and population near ocean hotspots, better projections for the coming decades of ocean frontal systems and impacts on phytoplankton are vital for local and global economies.
The full study and the reference list are available here.
“By looking at a few hotspots everywhere, we gain insights into global trends of ocean fronts. ”
— Amelie Meyer, Chief Investigator at the ARC Centre of Excellence for Climate Extremes