Fortran debugging – Part 2 stack traces
March 25, 2019 4:38 pm Comments Off on Fortran debugging – Part 2 stack tracesThis video describes what a stack trace is, and how to use it to find out where exactly in program code a program has crashed.

This video describes what a stack trace is, and how to use it to find out where exactly in program code a program has crashed.
In this first episode on Fortran Debugging, Holger Wolff explains the most common types of failures and the terminology of defect/infection/failure.

James Goldie has created the Collateral package to ease the pain of debugging. You can repeat a potentially risky operation—building a statistical model, rendering a plot, computing a tricky index—on as many groups of data as you want, and collateral will quickly show you which groups ended with errors, which ones returned results, and which ones finished but printed warnings or other messages.
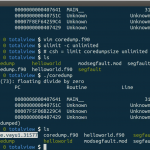
Model crashing halfway through? Don't want to wait in the debugger for hours? Scott Wales explains how to save crash information with core dumps for easier debugging.