Climate extremes are changing fast and it’s hard to keep on top of those changes. Developed by the ARC Centre of Excellence for Climate Extremes, a new climate dashboard provides the ability to examine trends of climate extremes using additional indicators of extremes. The climate dashboard (https://www.climdex.org/dashboard/) enables easy and reliable access to data. Examining temperature and rainfall extremes can be challenging. Here we highlight temperature extremes. Figure 1 shows two temperature measures – trends in the hottest day and coldest night of the year.
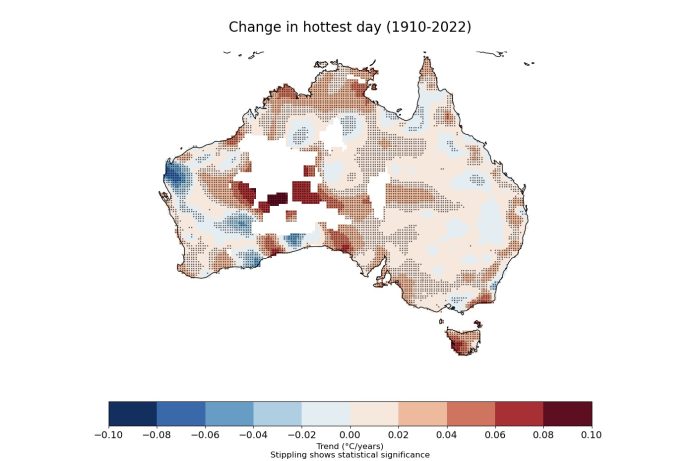
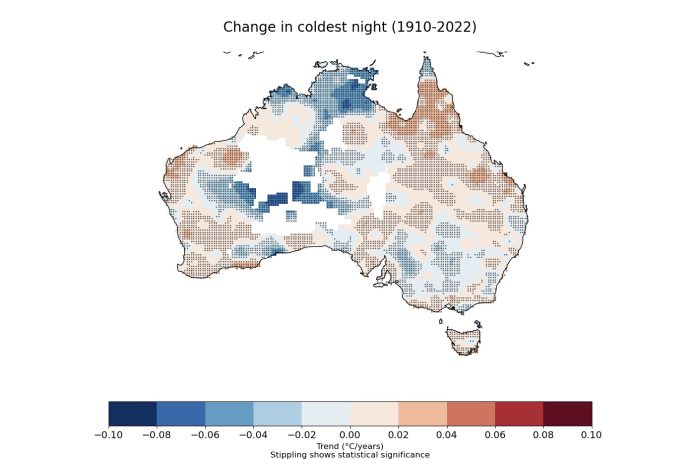
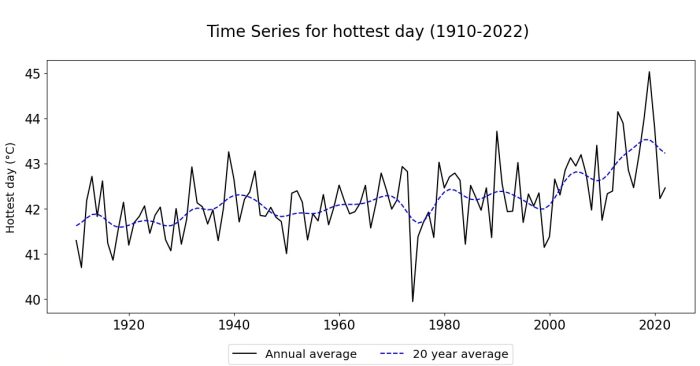
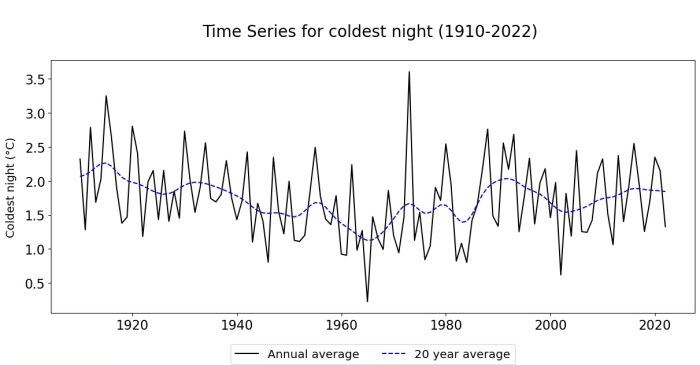
Figure 1: Maps show trends (°C/year) in the hottest day and coldest night of the year. Time series represent the Australian average each year from 1910-2022. Source: Professor Lisa Alexander, using the BoM’s Australian Gridded Climate Dataset (AGCD).
Figure 1 shows that the trend in the hottest day of the year is increasing almost everywhere, with strong warming over parts of Tasmania and in the far north of Australia. When viewed over time it shows variability but with an increasing trend since the 1940s. Increases in temperature extremes in Australia have been shown to be caused by anthropogenic emissions of greenhouse gases.
The trend in the coldest night of the year is more complex, with areas where the coldest nights are trending colder and areas where they are trending warmer. This is often associated with changes in the atmospheric humidity and cloud cover that strongly influences nighttime minimum temperature.
The ARC Centre of Excellence for Climate Extremes is developing additional metrics to help provide robust data for the analysis of extremes in 2024. For more information contact Professor Lisa Alexander or go to https://www. climdex.org/dashboard/
Research contact:
Professor Lisa Alexander, l.alexander@unsw.edu.au