by ARC Centre of Excellence for Climate Extremes Director Prof Andy Pitman
SUMMARY: We have undertaken an analysis of the Australian data in FLUXNET, which span a wide range of vegetation types, and rainfall regimes. The Australian data represented by Ozflux include the vast majority of the world’s observations of the land surface at high temperatures. They are virtually the only data measuring conditions likely to be experienced elsewhere due to future warming of the climate. The Australian FLUXNET data provide perhaps the world’s most valuable observations for building and evaluating the land models needed for projecting future droughts and heatwaves.
As climate changes, extremely high temperatures are becoming more frequent. Evidence to support this includes a series of recent high-profile heatwaves witnessed across Europe (2003, 2010), western North America, the Amazon (2005, 2010) and Australia (2012/2013).
Our understanding of how our climate will change in the future is based on simulations using climate models. A component of these models that is critical to understanding how temperature extremes and drought will change is the land surface model (LSM). This represents the exchange of water, energy and carbon between the atmosphere and the underlying land surface by simulating latent heat flux (Qle), sensible heat flux (Qh) and net ecosystem exchange (NEE) respectively.
This is not of mere academic interest; the land surface is important in simulating land-atmosphere feedbacks during drought. In general, as the land surface dries, the surface energy balance tends to partition available energy increasingly towards Qh and less towards Qle, which has important implications for atmospheric temperature, moisture and atmospheric boundary layer depth. This understanding of land-atmosphere processes links soil desiccation to the amplification of extreme heatwaves via land surface feedbacks. The global observing network of eddy-covariance towers known as FLUXNET includes over 900 sites and over 7000 site years providing our best ecosystem-scale estimate of the vegetation’s response to heat extremes (as seen here and here).

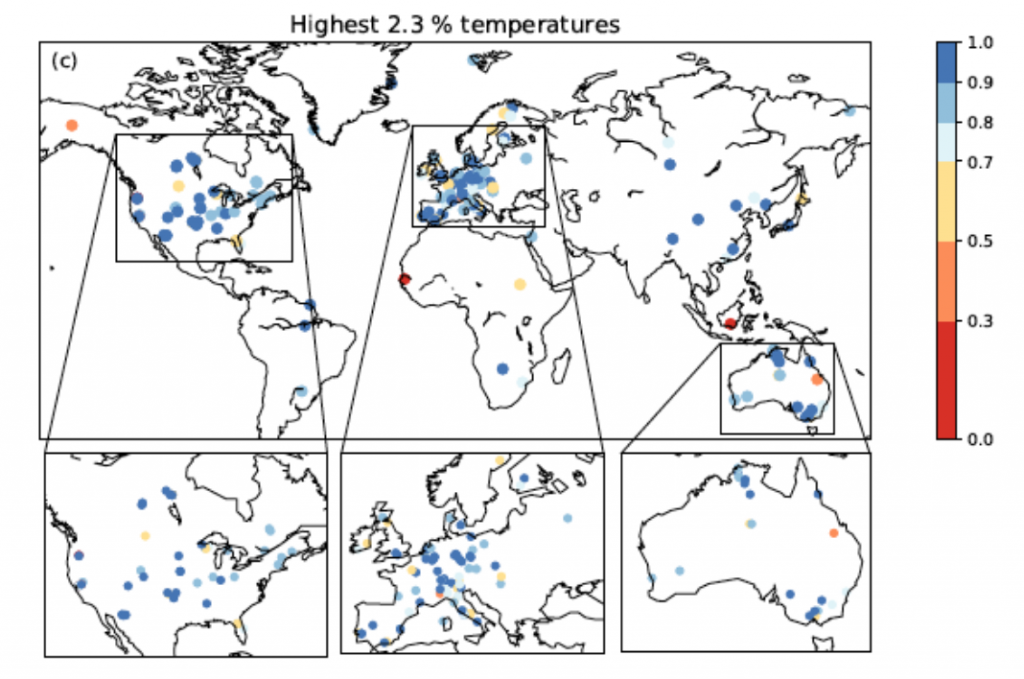
In a recent paper, we asked whether high quality measurements of Qle, Qhand NEE are available coincident with the highest temperatures in the FLUXNET data (we used 216 site-based data sets from the FLUXNET2015 and La Thuile data releases). Three regions stood out as relatively data rich; North America, Western Europe and Australia. This is shown (left), for the highest 2.3% of temperatures and it shows the ratio of observations of Qle relative to temperature. Where values are ~1.0, a FLUXNET site exists with measurements of Qleas often as temperature, while at ~0.5, half of the measurements of Qleare missing.
Note there are few measurements over very hot countries – in fact the hottest 97 countries in the world have no sites and the 98th hottest country is Australia.
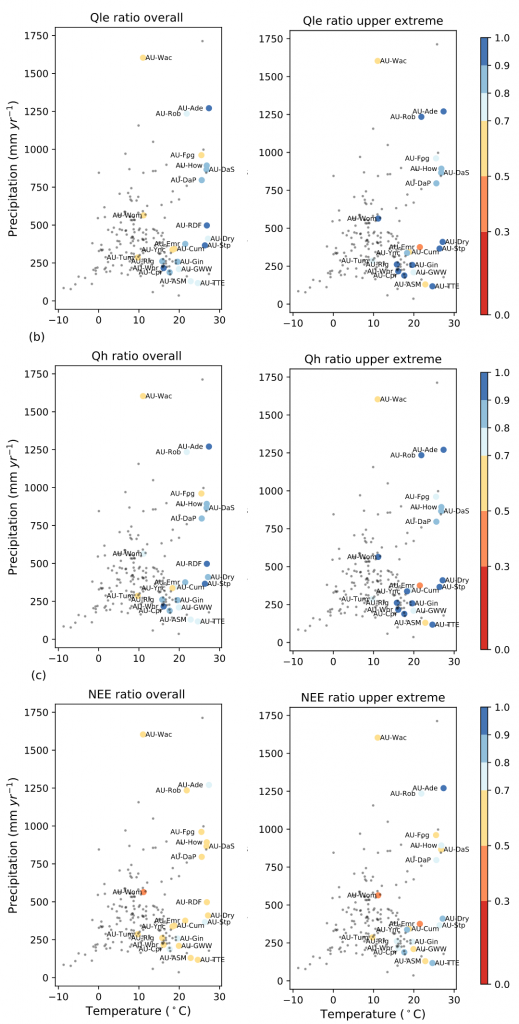
We decided to examine the availability of flux measurements for Australia for all temperatures and for the hottest 2.3% of measurements. The figure below shows similar results as the above figure but now the ratios are plotted against the rainfall and temperature at the site. We emphasise Australian sites as other global sites are shown in grey. The left shows the measurements ratios across the whole temperature distribution and the right for the hottest 2.3%. The Qle(top), Qh(middle) and NEE (bottom) ratios are shown. This figure shows some remarkable features. First, while it is not surprising that Australian sites are at the warm end of the temperature distribution, it is remarkable how most hot sites are in Australia. Second, the Australian sites span the whole precipitation range. Finally, most of the Australian sites have high measurement ratios for Qle and Qh. For NEE the measurement ratios are lower, but remain high by world standards.

What does this mean?
- Australia provides a high percentage of the world’s hot sites that measure Qle, Qh and NEE
- Because our measurements are the only ones taken at high temperatures, we cannot replace our measurements with any taken overseas.
- Our measurements enable us to examine Qle, Qh and NEE from wet to dry sites across a range of vegetation types endemic to Australia.
- These are the only observations climates that will be novel – that is do not currently exist – across Europe and North America because our observations are taken at hotter temperatures than elsewhere.
- Australia provides the only observations in the top 100 hottest countries. Virtually all hotter countries are developing counties without the capacity to host sites.Australian data may therefore provide useful insight into how land processes will behave in those countries and, in the future, in other regions as the climate warms.
Land surface models used in climate models need to reflect the conditions experienced now, and in the future. The Australian FLUXNET data provide almost the only data enabling that. These data are profoundly important to the global community. The land-atmosphere processes that occur over Australia occur in temperature regimes that are not paralleled elsewhere.We cannot build our LSMs using overseas data as these sites are too cool. Further, as Australia warms these data provide warnings to other countries of how their surfaces will behave.
Finally, the Australian observations reflect the unique Australian ecological systems and given our systems are adapted to high temperatures and high rainfall variability they offer insight for our modelling, but also indications of how land-atmosphere processes might function overseas in the future.

