- Heat stress is a combination of temperature and relative humidity. Increasing global temperatures due to climate change will make heat stress more common with serious implications for our health and environment.
- All climate models project an increase in heat stress across Australia. The amount varies between models.
- Regional downscaled models do not add certainty to local estimates of future heat stress but help by adding a range of possible futures.
What do climate models tell us about future heat stress in Australia?
One of the most dangerous effects of extremely hot temperatures is heat stress.
This has led to a growing interest in how hotter climates impact public health. Here we look at what global and regional climate models can tell us about future projections of heat stress over Australia.
Read more:
Kovats, R.S. and Hajat, S., 2008. Heat stress and 5. public health: a critical review. Annu. Rev. Public Health, 29, pp.41-55 https://10.1146/annurev.publhealth.29.020907.090843
Knutson, T.R., Ploshay, J.J. Detection of anthropogenic influence on a summertime heat stress index. Climatic Change 138, 25–39 (2016) https://doi.org/10.1007/s10584-016-1708-z
Russo, S., Sillmann, J. and Sterl, A., 2017. Humid heat waves at different warming levels. Scientific reports, 7(1), p.7477 https://doi.org/10.1038/s41598-017-07536-7
What is heat stress?
As the Earth’s climate warms, our exposure to extreme heat is increasing. Warming is likely to increase the frequency and intensity of heatwaves and therefore heat stress. Heat stress occurs when the body cannot get rid of excess heat. Heat stress is influenced by both temperature and relative humidity. Our bodies regulate heat by sweating to lose excess heat which helps to maintain an internal body temperature of 37°C. In hot and humid environments, sweating becomes less efficient, posing a threat even at moderate temperatures. (See also: Workplace heat stress, health and productivity – an increasing challenge for low and middle-income countries during climate change).

Relative humidity and our daily comfort
Relative humidity is a measure of how much moisture or water vapour is present in the air compared to the maximum amount of moisture the air can hold at a given temperature.
It is expressed as a percentage, with 100% relative humidity meaning the air is holding the maximum amount of moisture possible at that temperature, and lower percentages indicate that the air is not holding as much moisture.
Relative humidity tells us how comfortable we feel in different weather conditions. High relative humidity can make hot weather feel even more uncomfortable. Heat stress plays an important role in agriculture, weather forecasting, and indoor comfort.
Heat stress kills. The heatwaves, preceding the Black Summer fires of 2019/2020, killed an estimated 417 individuals in Australia while in the European summer of 2022, heatwaves were associated with over 60,000 excess deaths.
Heat stress affects the more vulnerable – particularly the elderly, young children, those with underlying medical conditions and people living in low socio-economic urban communities. The health impacts can be severe including in death, heat stroke, heat exhaustion, dehydration and cardiovascular diseases.
Physiological impacts from heat stress have flow-on effects on productivity, especially for those who work outdoors including in construction and farming.
This can have negative consequences for both individuals and the economy.
One way to measure heat stress is the wet bulb globe temperature (WBGT). The Australian Bureau of Meteorology (BOM) uses a simplified wet bulb globe temperature. This is calculated using temperature and relative humidity which are both commonly measured and modelled properties.
What do climate models tell us about heat stress?
Climate models allow us to see what heat stress might look like in the future. These powerful tools can be used to explore what our climate might be like under different emissions of greenhouse gases in the future e.g., 2050 or 2090. We looked at global and regional climate models to compare what they can tell us about future heat stress in Australia.
Using multiple climate models allows us to see where models agree and disagree and helps to improve our understanding. We can be more confident about the results where models consistently agree, and we understand why they agree. Where models don’t agree we need to investigate the process more. Using multiple lines of evidence such as, observations and historical studies (data from ice cores or tree rings), can increase our confidence in climate projections from models.
Global Climate Models and Regional Climate Models

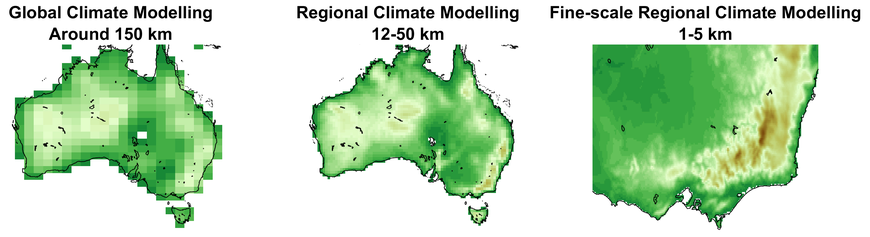
Global Climate Models (GCMs) are large-scale models that simulate large-scale climate patterns and changes on a global scale. Due to computational limitations, GCMs use a low spatial resolution, typically each pixel represents around 150 kilometres. As a result, they cannot capture small-scale regional climate features accurately.
The GCMs described here are part of the Coupled Model Intercomparison Project (CMIP5) which is a globally coordinated collaboration that allows scientists to understand climate change. Climate models are constantly being updated by research groups around the world as their understanding of the complex climate system improves.
Regional Climate Models (RCMs) cover a smaller area and have a higher spatial resolution or a fine scale, typically 1-50 km. RCMs can simulate regional climatic influences, such as changes in land surface, land cover and coastlines.
The RCMs described here are part of the Coordinated Regional Climate Downscaling Experiment (CORDEX) which is an international initiative for downscaling climate models to finer spatial detail. Downscaling is a process where the low resolution outputs of GCMs are converted into higher resolution climate information.
GCMs provide the large-scale climate patterns, while downscaled models use information from those models to simulate a region. Downscaling helps provide more detail for specific regions, but uncertainties can arise from the range of GCMs used and approximations in the GCMs and RCMs.
It is important to interpret and utilise model projections carefully. Policymakers can make more informed decisions for climate adaptation and mitigation by recognising the strengths, potential limitations and uncertainties of climate models.
Model set up to investigate future heat stress in Australia

The following model set up was used to explore future heat stress projections:
- Greenhouse gas emission scenario:
A representative concentration pathway (RCP) of 4.5 represents a future climate scenario with moderate greenhouse gas emissions. - Time period:
Two time periods were investigated. The near future is a 20 year period from 2040 to 2060 and the far future is a 30 year period from 2070 to 2100. - Global climate models (red boxes, Figure 3):
A total of 6 global climate models from the Coupled Model Intercomparison Project (CMIP5) were used. The Australian Community Climate and Earth System Simulator (ACCESS1) model is the Australian model. - Regional climate models used (pink, purple and orange boxes, Figure 3):
A total of 9 downscaled simulations from regional climate models were used. Three downscaled simulations of the ACCESS model, and six other models which are part of the Coordinated Regional Climate Downscaling Experiment (CORDEX) project.
A selection of simulations from the models in Figure 3 were investigated to demonstrate how different climate models project heat stress for 2040-2060 and 2070-2100 time periods.
What do global climate models tell us about heat stress in the future?
We first looked at what global climate models tell us about heat stress. All 6 global climate models in Figure 3 showed that heat stress will get worse, under RCP4.5 by 2050.
Figure 4a highlights the result from the Australian model ACCESS1 GCM, showing large increases in the number of days of extreme heat stress in the north of Australia (more than 80 extra days a year) with a smaller increase to the southwest of the country of 15 extra days of extreme heat stress per year.


The projections from these global climate models vary but overall they all indicate heat stress will become worse in the future.
What do regional climate models tell us?
Data from the global climate model ACCESS1 can be used to downscale three RCMs which are shown in Figures 4b, 4c and 4d.
- All three RCMs agree that heat stress will increase virtually everywhere in Australia.
Different downscaling methods applied to the same global climate model agree that heat stress will become worse. All agree that the largest increase occurs in the north of Australia and the least in the far south of the country.
- The number of extra heat stress days varies by location and magnitude.
The downscaled RCM simulation of Figure 4b suggests a more widespread area of heat stress increase than Figure 4c. The model used in Figure 4d suggests a generally smaller increase in extreme heat stress days.
Overall, all models used point in the same direction and we therefore have confidence that heat stress will get worse in the future across Australia because the models give us no evidence to suggest otherwise.
What do global climate models tell us about relative humidity?
The global climate model ACCESS1 (Figure 5a) indicates an increase in relative humidity over most of eastern Australia. An increase in humidity makes heat stress worse.

What do regional climate models tell us about relative humidity?
Downscaled models shown in Figure 5b and 5c differ sharply from the global climate model and both show changes in the area where relative humidity increases – the area of increase becomes very localised over Victoria (light blue patches). Some inland areas and the western areas decrease in relative humidity (brown patches, Figure 5b, 5c). The Figure 5d model shows a widespread decline in relative humidity across the southern parts of South Australia and Western Australia, but little change over Victoria. This pattern is very different from the global climate model used, or the alternative regional climate models used.
If we look back at the heat stress downscaled model in Figure 4d, we can see heat stress is less severe in some regions towards the west of the country. This is because we can see that relative humidity is decreasing in the model shown in Figure 5d and heat stress is influenced by both temperature and relative humidity.


What do model simulations tell us about relative humidity?
- Using a diverse set of models in climate research captures complexities, enhancing our understanding of projection uncertainties.
- There is no right or wrong model, either at the global or regional climate model scale.
- A larger set of GCMs and RCMs is likely to be inconclusive for relative humidity changes. This is because relative humidity is influenced by factors such as rainfall, which can be challenging to predict accurately.
- Using larger numbers of GCMs or RCMs may introduce more variability and different model behaviours. This makes it hard to see patterns for changes in relative humidity.
What do model simulations tell us about heat stress?
This demonstration shows that as temperatures increase strongly under future global warming, heat stress will increase but the changes in humidity are mostly quite small. The main factor driving heat stress is temperature.
There is another important implication of this result. A warmer atmosphere will tend to be thirstier for moisture as the atmosphere can hold more water under higher temperatures. This will tend to increase evaporation, and as a consequence landscapes are likely to be generally drier unless rainfall increases to compensate. This implies less water available for irrigation, human consumption or the environment even where there is no decline in rainfall.
Comparing different models and different scenarios
Figure 6 takes an in depth look at the changes in heat stress from multiple GCMs (green boxes) and RCMs (purple boxes) over 2040-2060 and 2070-2100 for Canberra, using a box and whisker plot.

For Canberra for a 20-year period from 2040-2060, the global climate model estimates the range of additional extreme heat stress days is between 14 days and 27 extra days (green box). Using the regional climate model it is 6-12 extra days (purple box).
- For Canberra for a 30-year period from 2070-2100, the global climate model estimates the range of additional extreme heat stress days is between 15 and 38 extra days (green box). Using the regional climate model, it is 11 and 20 extra days (purple box).
- The length of the boxes plus whiskers represents the full range of projections except for outlier data points.
- For the 2070-2100 scenario, the RCMs have a result which projects 32 extra days shown as the outlier data point in Figure 6. Climate scientists tend to discount outliers of this kind, but incorporating outliers in risk management may be important. It is certainly risky to only use the median.
The type of diagram used in Figure 6 is called box and whisker plot and is a useful way to compare different sets of data on one graph.
Given all global and all regional climate models show that additional heat stress days will occur in the future for Canberra, and no models show a reduction in heat stress days, concluding that there is a very high risk of additional heat stress days in the future is a robust conclusion from climate projections.
Future heat stress projections for Australian state and territory capitals
When we look at projections from climate models, we are looking for consistency to show that models are capturing climate processes well. We can look at the projections from a diverse set of downscaled products for heat stress and see where they are consistent.
When we looked at a selection of Australian cities (Figure 7), we found that for whichever GCM, RCM or city shown, heat stress gets worse in the future. All figures show additional heat stress days occurring in the future.

Projections of temperature for Australian state and territory capitals
We looked at the same cities and projections for temperature. Every model simulates the future getting hotter. This is simulated consistently by the models for every city. Extreme heat stress is strongly influenced by increasing temperatures.
Projections of relative humidity for Australian state and territory capitals
When we looked at the same cities’ projections for relative humidity, the models showed a mixed picture. Some models simulated an increase in relative humidity, amplifying the impact of temperature, while some helped offset the increase in temperature by decreasing relative humidity.
Interpreting the projections can be complex. For each city, sometimes the RCMs predict a smaller increase in extreme heat, sometimes they predict a larger increase. Sometimes the RCMs are more consistent than the CMIP5 models, sometimes they are less consistent. This is the nature of the science of climate projection. As you approach finer scales for variables other than temperature the direction of the change often becomes highly uncertain, particularly as you become focussed on extremes.
What can a Regional Climate Model projection tell us?
RCMs bring an important additional capability to assessing future climate change. A heat stress single value from a GCM covering 100 x 100 km may only give you one output value for a huge area which is not very useful for local scale information. However, if you use an RCM with a spatial resolution of a few km over a city, the actual changes simulated for the city as a whole might not be reliable, but the patterns might be. An RCM might differentiate between types of urban form, greenspace, distance from the ocean for instance. These can have a large impact on the detailed patterns of heat and heat stress across a city.
Therefore, although there may be limited confidence in the accuracy of the values from a RCM over a city, you may be able to tell which parts of a city might be most vulnerable to heat stress.
Heat stress in Australia will get worse
In Australia, heat stress will almost certainly get worse in the future. We can be confident about this because temperature is simulated well by our models, and temperature is increasing due to human emissions of greenhouse gases.
However, the magnitude of heat stress increase remains uncertain because it is difficult to predict the detailed regional changes in relative humidity.

Implications for adaptation
- This example has demonstrated that extreme heat stress will get worse. Since this is unlikely to change as new climate models or downscaling techniques emerge, it is important to act now on this information.
- Regional downscaling adds to the range of projections: RCMs can add insight into possible patterns of change in heat stress and just as useful as global climate models.
- Use multiple lines of evidence: this includes multiple global models and multiple regional models. The existence of one, or the other, does not negate the value of using all available lines of evidence. Multiple lines of evidence allow us to be more confident in the outcomes produced when there is strong agreement.
- There is no “right” or “wrong” downscaling method or global climate model: regional downscaling can change the sign of some variables (e.g., relative humidity). They provide “different” additional information.
Decision-makers can use climate models for adaptation strategies and policies. A collaborative approach between scientists, policymakers and public health officials allows for more effective and sustainable solutions to be achieved.
The ongoing investigations by the ARC Centre of Excellence for Climate Extremes and from 2024, the ARC Centre of Excellence for the Weather of the 21st Century play a critical role in improving our models. Models are providing a better understanding of how heat stress will evolve in Australia. However as temperatures continue to rise, there is no need to wait before you act.
Briefing note created by Dr Charuni Pathmeswaran and Professor Andy Pitman.
Reference list and author bios available in the PDF version below.