Picture (above): Thunderstorm. Credit: Rodrigo Souza (Pexels)
The largest rivers on Earth are not on the ground, but in the sky. Our new study, published in Environmental Research Letters, showed that nine out of ten of the most expensive floods in New Zealand (2007-2017) occurred during an Atmospheric River event, and seven to all ten of the top ten most extreme rainfall events at eleven different locations occurred during Atmospheric Rivers.
Atmospheric Rivers are over 2000km long, flow in the first few kilometers of the atmosphere and transport more water than the Amazon and Nile rivers combined. There are about six of these weather systems on the globe at any time. These huge highways are responsible for moving 90% of atmospheric moisture from the tropics to the poles. Despite their global importance, AR research has been concentrated in the Northern Hemisphere, which is why a lot of Southern Hemisphere folk have never heard of them.

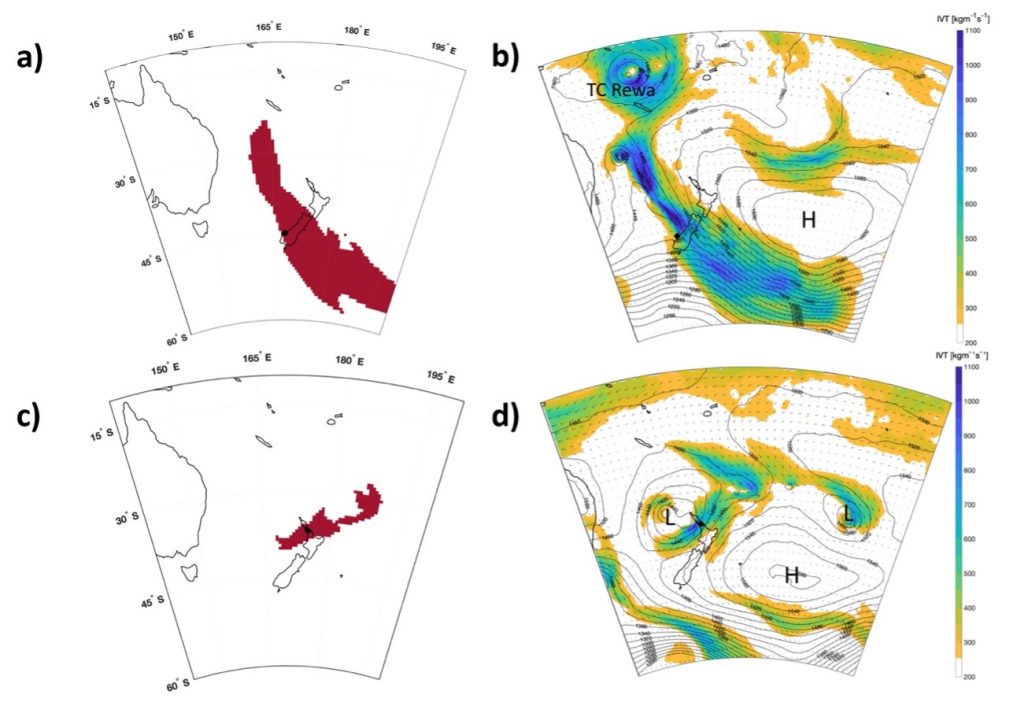
Figure: a) mask showing identified AR during rank-one Milford Sound rainfall event (1800UTC, 21st Jan 1994; 538mm in 24hrs), b) coloured contours are Integrated Water Vapour Transport during rank-one Milford Sound rainfall event and black contours are geopotential height at 850hPa level, c-d) are the same as a-b but for the rank-one Auckland rainfall event (0000UTC, 16th Feb 1985; 161mm in 24hrs). Black diamonds indicate locations in question.
Our research quantifies the impacts of Atmospheric Rivers on extreme rainfall and flooding in New Zealand. We used an Atmospheric River Identification algorithm developed at the University of Melbourne to study Atmospheric River impacts (Reid et al. 2020); station rainfall data provided as a part of a collaboration with the National Institute for Water and Atmospheric Research, New Zealand; and flooding impact estimates from the Insurance Council of New Zealand.
Since Atmospheric Rivers are easier to predict than extreme rainfall and can be forecasted up to five weeks in advance (Baggett et al. 2017; Lavers et al. 2014), this result may lead to improved forecasts of extreme rainfall and flooding events in New Zealand.
| Station | Number of top 10 rainfall events associated with an atmospheric river |
| Auckland | 9 |
| Christchurch | 8 |
| Dunedin | 9 |
| Gisborne | 8 |
| Greymouth | 9 |
| Hamilton | 8 |
| Milford Sound | 9 |
| Nelson | 9 |
| New Plymouth | 8 |
| Tauranga | 7 |
| Wellington | 10 |
- Paper: Reid, Kimberley J., Suzanne M. Rosier, Luke James Harrington, Andrew David King, and Todd P. Lane. “Extreme Rainfall in New Zealand and Its Association with Atmospheric Rivers.” Environmental Research Letters, 2021. https://doi.org/10.1088/1748-9326/abeae0.
References
Baggett et al. 2017: Baggett, C. F., Barnes, E. A., Maloney, E. D., & Mundhenk, B. D. (2017). Advancing atmospheric river forecasts into subseasonal-to-seasonal time scales. Geophysical Research Letters, 44(14), 7528–7536. https://doi.org/10.1002/2017GL074434
Lavers et al. 2014: Lavers, D. A., Pappenberger, F., & Zsoter, E. (2014). Extending medium-range predictability of extreme hydrological events in Europe. Nature Communications, 5(1), 1–7. https://doi.org/10.1038/ncomms6382
Reid et al. 2020: Reid, K. J., King, A. D., Lane, T. P., & Short, E. (2020). The Sensitivity of Atmospheric River Identification to Integrated Water Vapor Transport Threshold, Resolution, and Regridding Method. Journal of Geophysical Research: Atmospheres, 125(20). https://doi.org/10.1029/2020JD032897
