Picture (above): Storm front builds over Darwin. Credit: Take a Squiz Photos Flickr (CC BY-NC-ND 2.0)
A new paper by Martin Jucker and colleagues reveals the choice of a particular convection-resolving model (CRM) has a much larger impact on the results than increasing resolution. It also suggests the behaviour of CRMs is tied to model internals instead of the phenomena they are trying to reproduce. The paper highlights fundamental difficulties with CRMs and points to observational campaigns as a way to resolve these issues.
Convection-resolving models (CRMs) are the work horses of weather forecasting. But they are also often used as “truth” to validate convective parameterisations in climate models, or as replacements for missing observations. CRMs have also become the primary source of training data for machine learning algorithms in the quest for smarter ways to deal with convection in coarse resolution climate models. But can we trust them?
Everyday convection
Most of the time, people study particular events with, e.g., strong convective activity, large rainfall or specific storm structures. This is fine if the goal of the study is to better understand the impact of these events. But due to two main problems, it is not a good idea if the goal is to learn more about the model itself: First, such events are often forced by the larger scale state of the atmosphere, ocean, and land, meaning the CRMs will reproduce them simply because their boundary conditions tell them to do so. Second, these events have to be extreme in some sense to be of particular interest. Thus, model development, tuning and evaluation are intrinsically biased towards rare situations, leaving out the bulk of everyday convective activity.
With an international team of collaborators, including the UK Met Office, the Australian Bureau of Meteorology and the Universities of New South Wales, Melbourne and Monash, we set out to test how good two of the most widely used CRMs are in everyday situations of locally forced convection. The testbed was Darwin, NT.
Focusing on locally forced convection means that we left out periods of extreme rain (such as monsoons, cyclones and such), and concentrated on a period of time when convection over Darwin was forced by local mechanisms, and not forced by what comes in from the boundary conditions or initial conditions. We also made sure both models saw the same boundary and initial conditions (ERA-Interim).
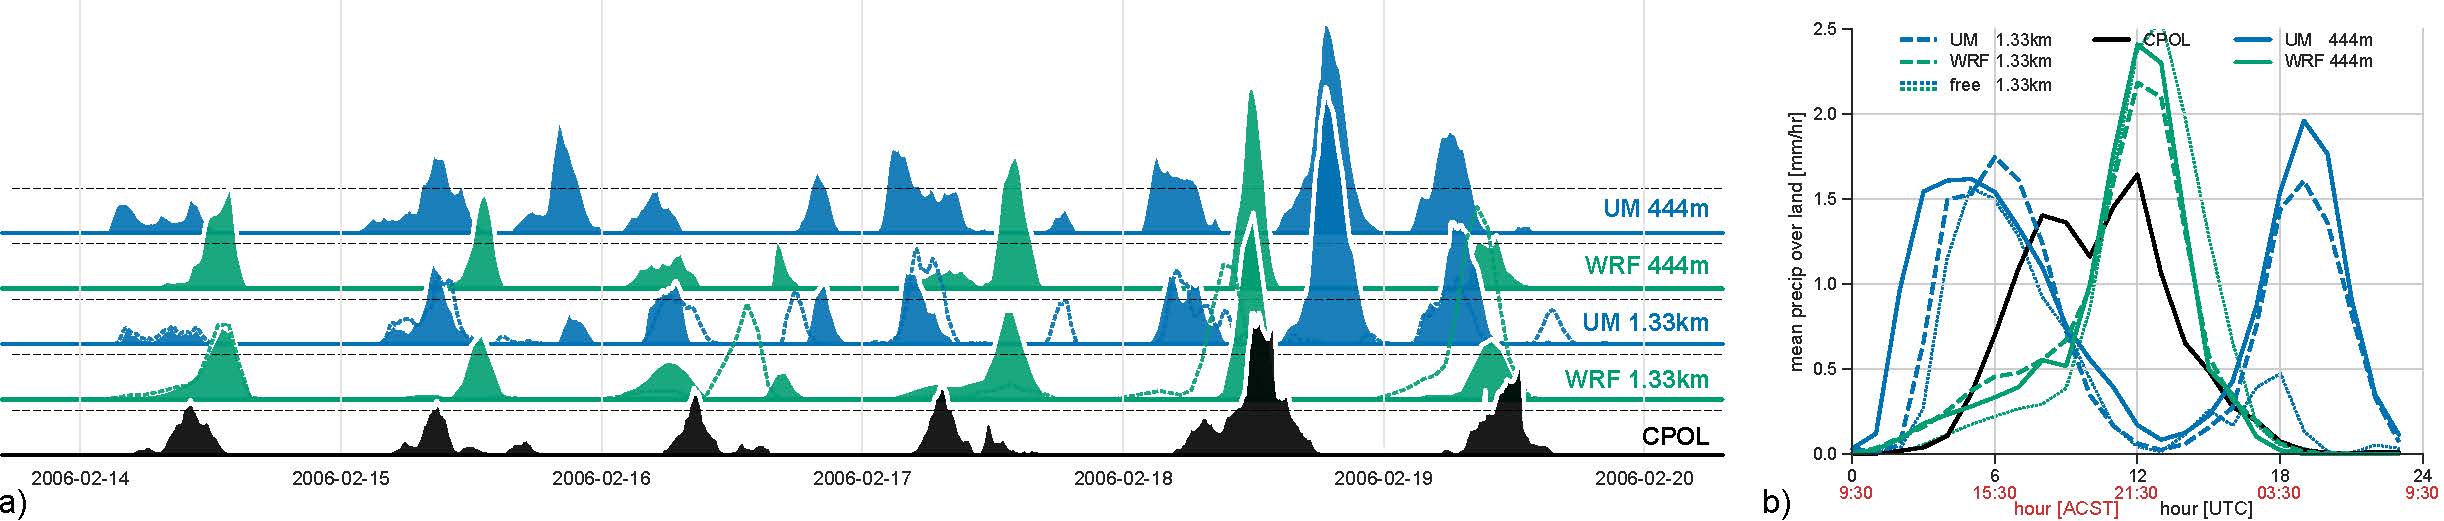
What we found was that each model produced what it liked best, independent of what happened in the real world. The UM produced very strong, small thunderstorms early in the day, every day. WRF produced an impressive squall line in the evening, every day. In reality, there was a variety of convective activity peaking in the late afternoon, and one squall line in six days. For illustration, the resulting area-averaged precipitation time-series are shown in Figure 1a), and the resulting diurnal cycles in precipitation in Figure 1b).
Model choice defines the outcome
One common belief is that CRMs converge towards the truth as grid spacing decreases. We found that this is a myth, at least down to resolutions of the order of a hundred meters (note that current operational forecasts from the Bureau run at 2.2km – we went down to 145m). What we observe instead is that the differences between simulations run at varying resolution are much smaller than differences between models (differences between colours are larger than between lines of same colour in Figure 2).
This is concerning as it means that much of the result is pre-defined by the choice of model, not by what happens in reality. There may be historical reasons for this: The UM was and is developed by the Met Office in the United Kingdom, a place in the world where convection is a concern only in extreme situations. WRF is a child of a community of researchers who love squall lines. No surprise the child likes squall lines too.
Figure 2 (above): Videos of typical behaviour in the UM (left) and WRF (right). Shown is CAPE in black, surface potential temperature in yellow/blue, precipitation in purple, reflectivity in white.
Where to?
It is not a surprise to the research community that the CRMs we tested didn’t perfectly mirror reality in these situations where no large-scale phenomenon was the main driver of convection. What was a surprise is that resolution didn’t change much, and that both models stuck to their inherent behaviour.
But then there are two questions: Why and how? Why do the models behave the way they do? How do we improve them?
This is extremely, and frustratingly, difficult to answer. One reason is that there are lots of things going on in atmospheric convection that we still don’t understand. There is a fundamental difficulty in the quest of improving CRMs in that we are pushing the limits of our physical understanding, and we don’t have the observations to learn from and compare to. Convection is inherently difficult to observe (ever flown through a thunderstorm?), and many diagnostics we think play a role are not directly measurable, or if they are, we don’t have enough spatial or temporal resolution (or both) in the observations. Without further concentrated observational campaigns where a large variety of measurements are taken simultaneously, concurrently, and with high resolution, we cannot truly tackle the question of how to improve the models because we don’t know how they should behave in the first place.
The good thing is that studies like ours can point to what exactly needs to be observed more closely. We believe from our work that the boundary layer holds many of the answers – a part which is still parameterised even in these high-resolution simulations. And we found that to further investigate the why and how, there is no need to burn through precious computing resources with very high-resolution simulations, as the same problems are apparent at a much coarser resolution.
- Paper: Jucker, M., Lane, T., Vincent, C., Webster, S., Wales, S. and Louf, V. (2020), Locally forced convection in sub‐kilometre scale simulations with the Unified Model and WRF. Q J R Meteorol Soc. Accepted Author Manuscript. doi:10.1002/qj.3855