
Types of models
We discuss three types of models: Weather Forecast Models, Physical Climate Models and Earth System Models in the context of:
- Resolution versus long simulations
- Projections versus predictions
- Implications of Representative Concentration Pathways (RCPs) or Shared Socioeconomic Pathways (SSPs)
- Ensemble projections compared to ensembles of opportunity.
Resolution versus long simulations
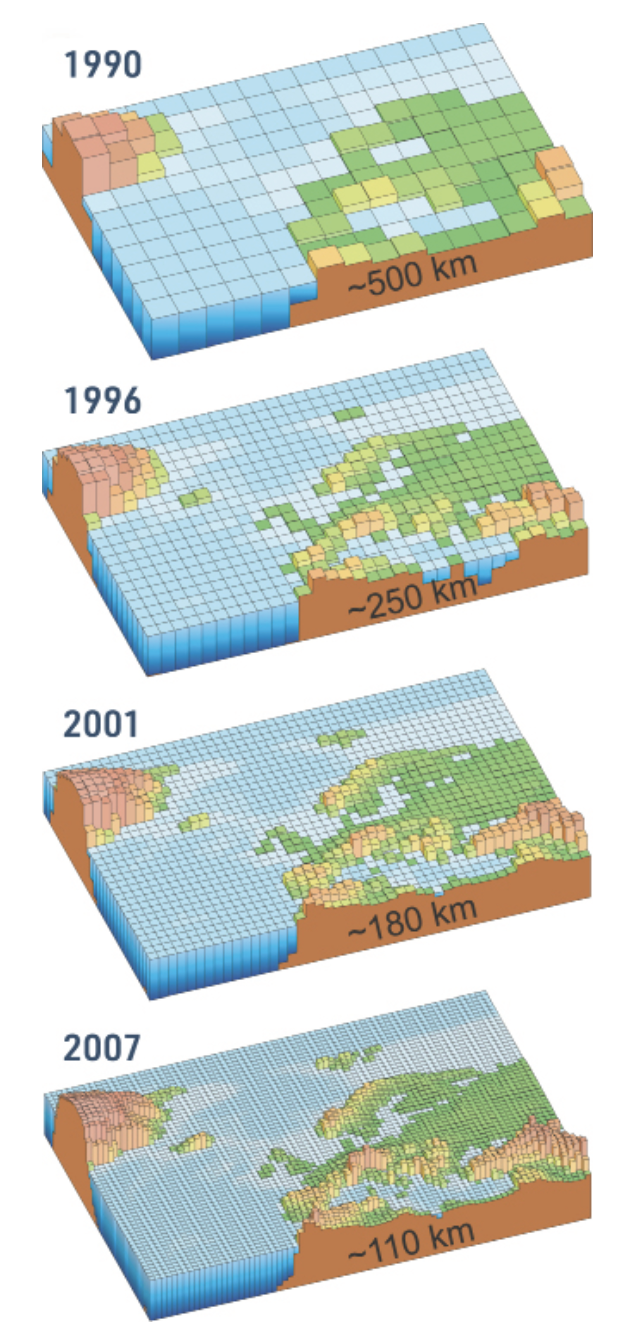
Weather Forecast Models use a very fine spatial grid – often around 25 km across Australia and around 1.5 km over the major cities. This is very expensive in terms of computing time, but because these models are typically only run for a week, it is possible to do.
Earth System Models use coarser grids – around 100 km or coarser – for the whole globe and are run for up to a millennium, though more commonly several centuries. This is affordable in terms of computing time because the expense of running several centuries is compensated by using a relatively coarse resolution (Figure 1).
Physical Climate Models can use a variety of resolutions. Some are as high as 5 km, some as coarse as 200 km but all are run for the whole globe. Normally, the 5km resolution models can be run for a year or two at most. The 200 km models can be run for around 2 centuries. This means the 5 km resolution models cannot currently be used for climate projections – they are too computationally expensive. A question sometimes arises, why is the cost of a 5 km resolution so prohibitive?
Climate models are 3-dimensional so if you double the resolution, you end up with 23 = 8 times more grid squares. At the same time, the timescale over which the equations are solved has to be shortened, which roughly doubles the computational cost to 16 times. In reality it’s worse than that but imagine your experiment is going to take 6 months to complete. If you double the resolution, it will take sixteen times longer – 8 years. Worst still, as a rule of thumb, it takes 5-10 years for a modelling group to build a model at double the resolution so that the quality of the simulations improves to warrant the extra cost.
In short, moving to higher resolution is very challenging – one needs far more powerful computers, much larger data storage, considerable technical expertise and a large and long term research effort by scientists.
Projections versus predictions
The difference between a projection and prediction is determined by the initial state of the model.
A weather forecast model is used to forecast the weather of tomorrow, or a few days into the future.
The model is initialised using the best possible knowledge of the atmosphere, ocean and land. That often includes detailed information from satellites, surface observations, aircraft and ships.
These observations are brought together in the form of an initial state for the model and this initial state is evolved forward in time on a large computer system for a number of days. One of the important advances in the last decade is that it is common to modify the initial state (based on uncertainty for example) and re-run the weather forecast. Ideally, this is done many times to help determine how confident we should be about a weather forecast. This use of an observed initial state makes weather forecasting a prediction. The goal is an accurate prediction of what will happen to the weather over the next few days for specific places, and it matters if a heavy rainfall event is correctly predicted on day 3 of a forecast, or incorrectly forecast on day 4.
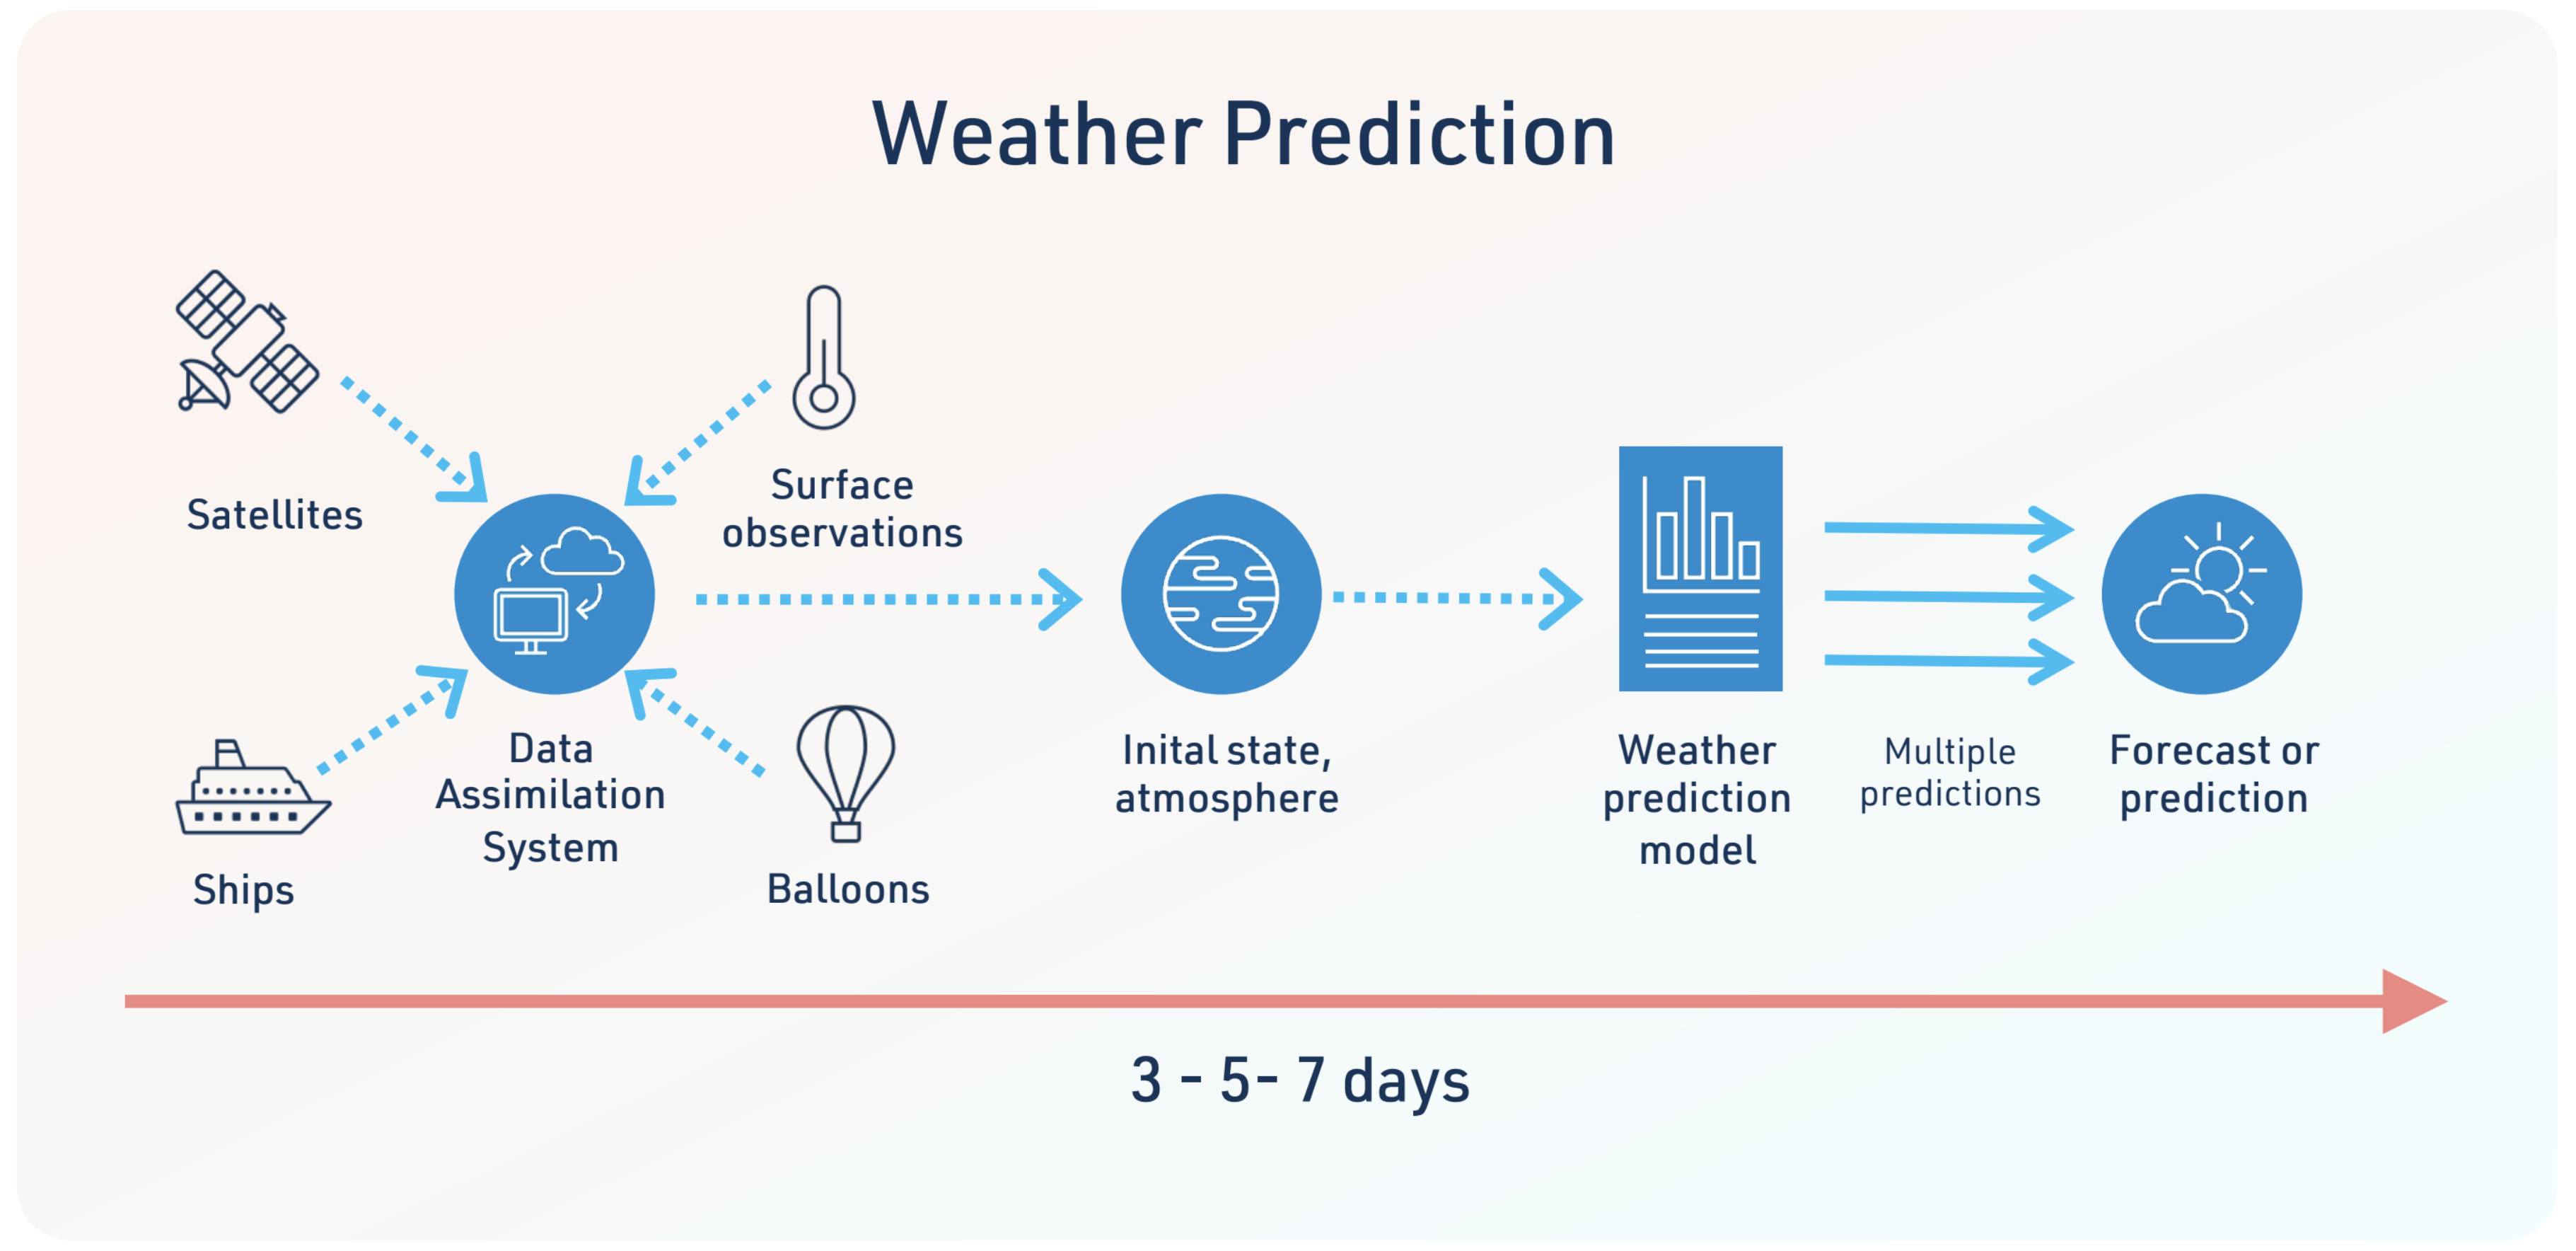
The quality of a weather forecast degrades over time because we cannot know the initial state perfectly, and there are always errors in how our models represent processes. There is little predictive skill in weather forecasts beyond about 10 days. However, the skill in weather forecasting has improved over time and generally weather forecasts are skilful on timescales of 3-5 days.
A seasonal or decadal prediction system is similar to a weather forecasting system in that it starts from an observed state.

However, while a weather forecast prediction starts from the initial state of the atmosphere, a seasonal or decadal prediction system tends to need information on the state of the ocean, ideally more slowly changing parts of the ocean. Like a Weather Forecasting system, this initial state is changed to reflect uncertainty, and the system re-run, to create an ensemble of predictions.
However, while a weather forecast prediction starts from the initial state of the atmosphere, a seasonal or decadal prediction system tends to need information on the state of the ocean, ideally more slowly changing parts of the ocean. Like a weather forecasting system, this initial state is changed to reflect uncertainty, and the system re-run, to create an ensemble of predictions.
A projection for 2050 under an RCP or SSP scenario does not attempt to determine whether January 16th, 2050, over Canberra will be a very wet day. Rather, an earth system model asks whether the changes in the RCPs or SSPs change the statistics of rainfall over a large region (perhaps 150 x 150 km) containing Canberra such that summer is more or less likely to experience heavier rainfall events.
A Physical Climate Model can be used in either prediction or projection studies. For example, a Physical Climate Model can be initialised for a specific date, and then run forward for a season or a decade to examine how climate might evolve. This can be done with a date a decade ago and assess whether the model could accurately predict how climate actually evolved. This is not to try to replicate a Weather Forecast Model – rather it is possible that by representing slow-changing parts of the ocean, some information might help us improve the prediction of major events like large-scale droughts. A Physical Climate Model can also be used in the same way as an earth system model to undertake projections, with a long spin-up period before using an RCP or SSP into the future.
Implications of Representative Concentration Pathways (RCPs) or Shared Socioeconomic Pathways (SSPs)
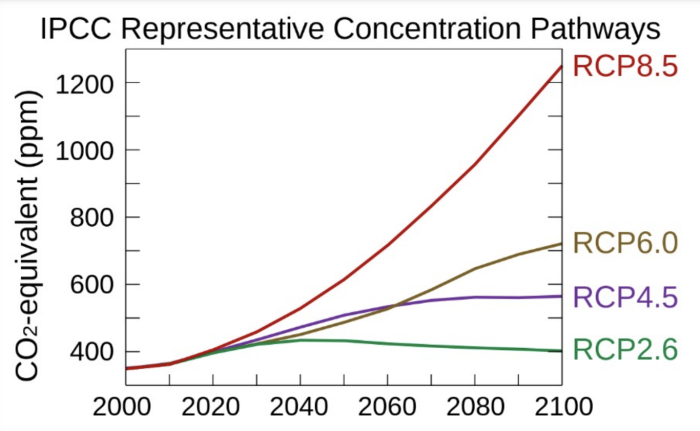
Figure 6: All forcing agents’ atmospheric CO2-equivalent concentrations (in parts-per-million-by-volume according to the four RCPs used by the fifth IPCC Assessment Report to make predictions Representative Concentration Pathway – Wikipedia
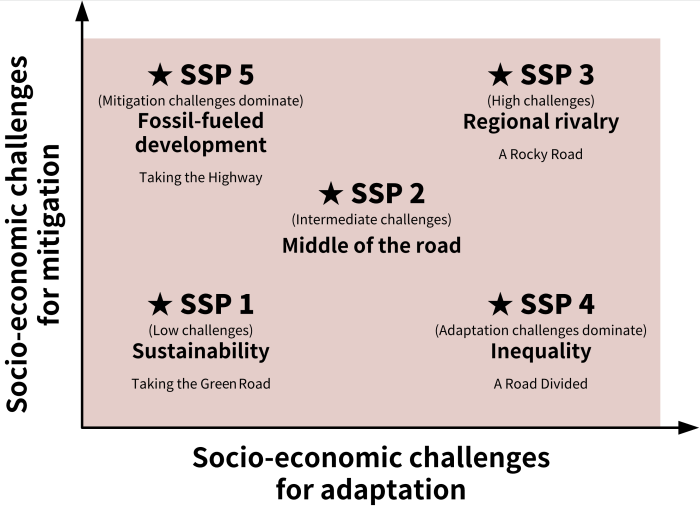
Figure 7: SSPs mapped in the challenges to mitigation/adaptation space. Shared Socioeconomic Pathways – Wikipedia
Both RCPs (Figure 6) and SSPs (Figure 7) provide a future greenhouse gas emissions or future greenhouse gas concentrations scenario along with possible future aerosols. SSPs also include future land use change scenarios. None of these are designed by climate scientists – they are the domain of demographers, technologists and economists.
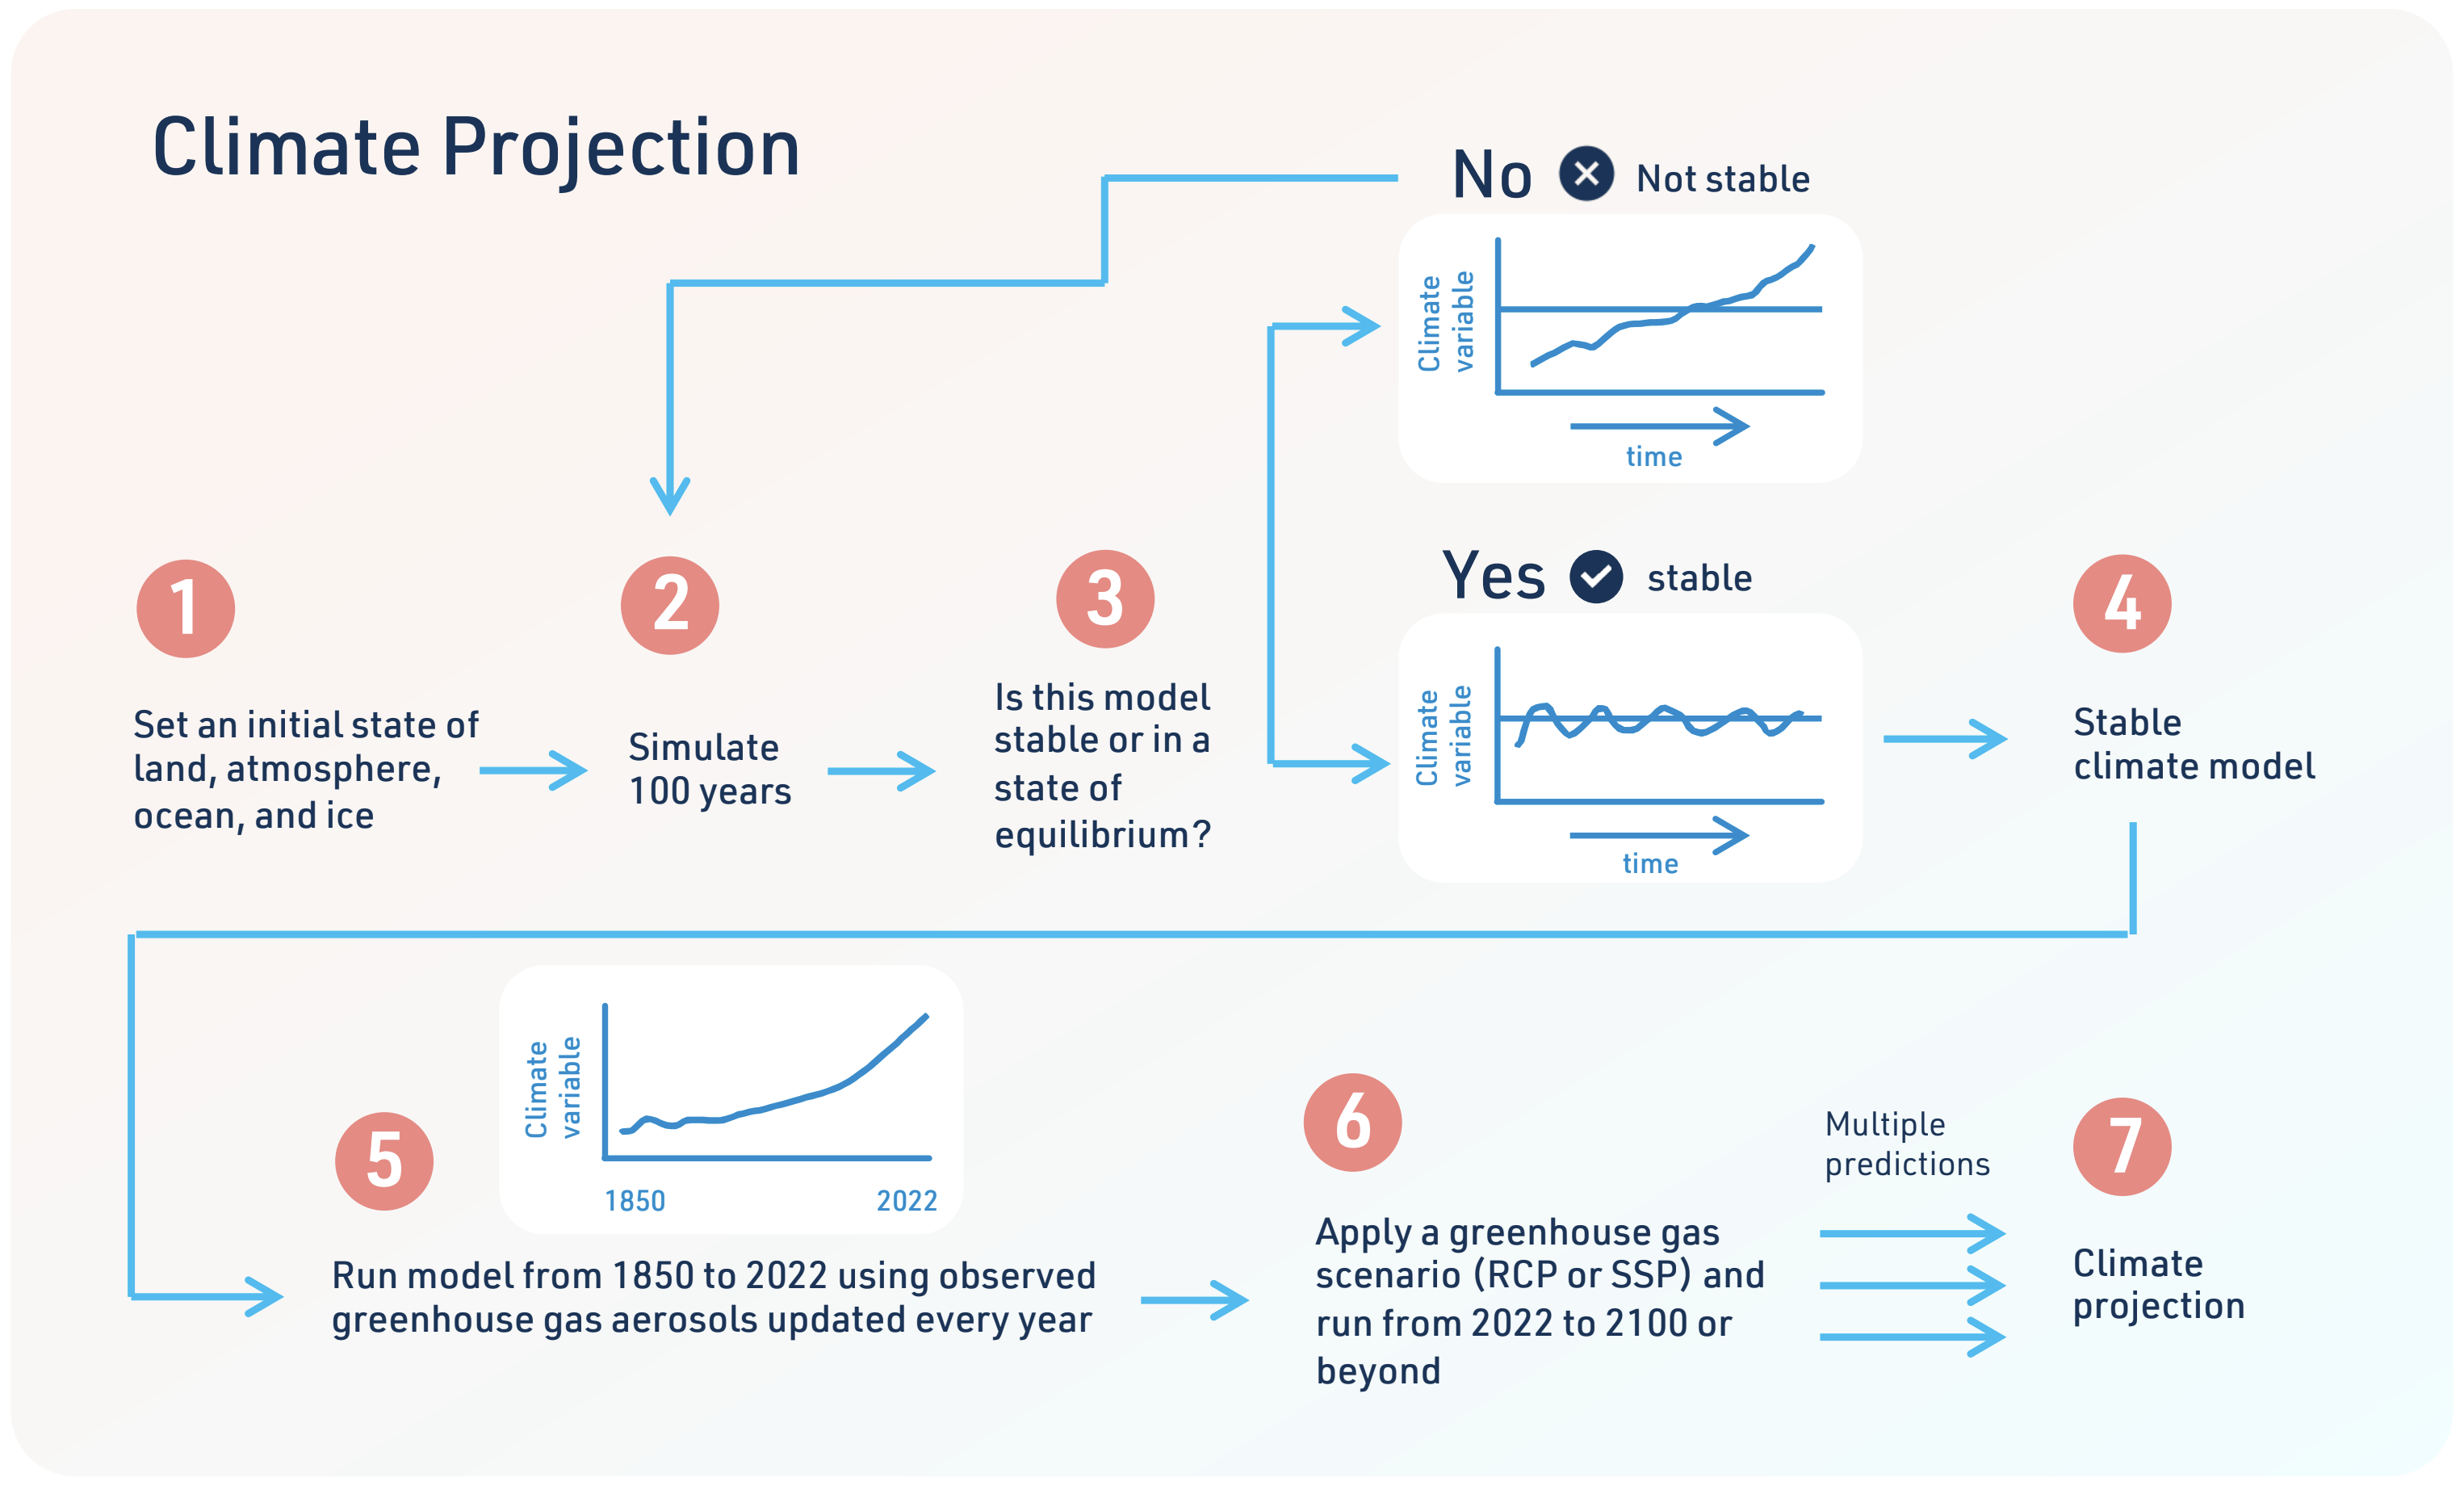
When an Earth System Model or a Physical Climate Model uses an RCP or SSP the greenhouse gas concentration in the model’s atmosphere, the aerosols and the land cover are updated each year. However, the change in these things from one year to the next, or one decade to the next are small. Specifically, on a 10-year timescale, the changes they cause to the amount of energy in the climate (known as radiative forcing) are small relative to natural variability.
This means that it makes no sense to ask an Earth System Model or a Physical Climate Model to project the climate of 2030 relative to 2020. Realistically, the change in the radiative forcing needs to accumulate over several decades before the impact can be separated from the natural variability. So, both an Earth System Model or a Physical Climate Model can be used to compare 2050 with 2020, or 2080 compared to 2050. Comparing simulations of 2050 with 2060 means you are comparing estimates of natural variability and not the impact of greenhouse gas emissions.
The good news, however, is that which RCP or SSP has little effect if your interests are for 2030 or 2040. However, it does matter a lot looking further into the future towards the end of this century.
Ultimately, the use of all the types of models discussed here depends on large-scale supercomputing, and software engineering to make the code work, and to make the code more efficient.
Research is performed by a large number of students, research fellows and senior academics with exceptional maths, physics, computing and data mining skills.
In Australia, the supercomputing mainly comes from the National Computational Infrastructure Facility which is crucial to our work. The software engineering comes from the ACCESS National Research Infrastructure Facility.
The ARC Centre of Excellence for Climate Extremes provides opportunities for students and research fellows, but there are never enough, and we are always seeking more talented students.
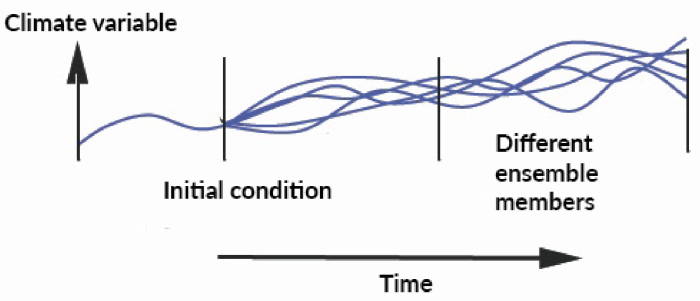
Figure 8: Principle of initial condition ensemble simulations. By choosing slightly different sets of initial conditions, equally likely realizations of a climate variable (such as temperature) are created. Numerical Climate Models and Climate Change | AIR Worldwide (air-worldwide.com)
Ensemble projections, ensembles of opportunity
If you take any one of a Weather Forecast Model, Physical Climate Model or Earth System Model and run it once, the uncertainties in the simulation cannot be assessed – you do not know if it is a useful or useless simulation. All of these models really need to be run many times to build confidence in simulations (Figure 8).
To determine a climate response to changes in greenhouse gases, or land cover change, requires a model to be run many times – this is known as an ensemble. It can be averaged over the many simulations or handle each simulation separately.
Some climate models have been run a very large number of times and this allows questions like “what is the probability of something happening according to my model?” rather than this is what my simulation says will happen.
The Coupled Model Intercomparison Project (CMIP)
The Coupled Model Intercomparison Project (CMIP) consists of many different Physical Climate Models and Earth System Models, each undertaking between 1 and many ensemble simulations. This creates an enormous data set – known as an ensemble of opportunity.
CMIP Phase 6, the latest phase, is carefully designed in terms of what simulations need to be conducted by each modelling group. However, there are no standards, or performance requirements to be part of CMIP-6. The data is provided by a range of models, with widely varying attributes. Thus, CMIP6 contains the most current climate models but it is important to appreciate that these models are excellent for some purposes, but inappropriate for others.
Using the CMIP6 archive can be challenging since CMIP6 contains many climate models, all providing outputs which are stored in the archive individually.
Running climate models
Imagine we have four models of varying suitability for describing a process: W, X, Y and Z where model W is the best for our work and model X is not so good.
For model X, 10 simulations are available, but for models W, Y and Z only 1 simulation is available.
If you average over all four models, your best model, model W, becomes only small fraction of the overall result. Your “best model” is barely represented in the overall average. The average is heavily influenced by the 10 simulations from model X and the bad model dominates the final answer.
Many researchers simplify this by using the first simulation archived in CMIP6 from each model (the so called first realisation). This throws away a vast amount of useful data and weights all models equally. You might think the answer is to just use model W (the best model), but this assumes the best model assessed for the present day is necessarily the best model at simulating the future. In reality, it is very hard to determine which model is best, and it tends to be a different model for different questions.
Finally, there are no constraints on which models are included in CMIP6 so it might be models W, X, Y are all from the same group (with minor variations) while model Z is completely different. Averaging over these models would lead to a significantly biased result.
In short, CMIP6 contains very valuable information – hugely valuable for climate science and our understanding of climate change.
However, CMIP6 represents a minefield for the unwary and the science community is not in general agreement on how best to use an ensemble of this kind. Crucially, as an ensemble of opportunity, it has very different information content than an ensemble undertaken with a single model. These issues also apply to projects like CORDEX (Coordinated Regional Climate Downscaling Experiment).
For users of CMIP6 data, the best advice we can offer is to talk to climate modellers who built the ensemble, or climate scientists who use this data on a routine basis.
How we build climate models – communities at work
Many years ago, a common task for a PhD student was to “write a climate model” and this was effectively possible for a student with a good grasp of mathematics and physics. Today, our state-of-the-art climate models can exceed one million lines of code which is vastly beyond what a PhD student could hope to accomplish.
Virtually all modern climate models are now institutionalised – in major facilities like the UK Meteorological Office, the National Center for Atmospheric Research, the Geophysical Fluid Dynamics Laboratory (GFDL) which links the US National Oceanic and Atmospheric Administration with Princeton University or other large-scale consortia.
The Australian model – the Australian Community Climate and Earth System Simulator (ACCESS) is supported by a consortium of universities, CSIRO, the Bureau of Meteorology and crucially the ACCESS National Research Infrastructure Facility funded via the National Collaborative Research Infrastructure Strategy (NCRIS).
This is an important and large-scale endeavour where key components of the ACCESS model are sourced from the UK Meteorological Office and the US Geophysical Fluid dynamics Laboratory (GFDL) at the National Oceanic and Atmospheric Administration (NOAA). Critically, however, Australia adds ocean biogeochemistry and land surface processes developed in Australia to this modelling system.

Improving climate models
The development of an improved Earth System Model or Physical Climate Model is extremely challenging. Imagine a process such as intense rainfall and how this is simulated by climate models. Imagine intense rainfall is important to you, and you find that your model is not doing well.
Rainfall is a very complex phenomenon involving processes which include bringing moisture to a location (dynamics), processes that cause the moisture to be pushed higher into the atmosphere (fronts, convection), and many other interactions with weather-scale phenomenon like East Coast Lows.
What do you need to improve in order to fix your model? Is it the large-scale dynamics, the simulation of specific phenomenon, or detailed processes in the atmosphere like convection? Or all of these?
Improving a model first requires a diagnosis of the errors, and then improving how processes are represented as computer code in the model, very significant testing and model evaluation and so on – this can take 3, 5 or 10 years.
Improving a model is therefore a long term endeavour, requiring considerable scientific understanding, maths and physics expertise, computer coding, software engineering, new sources of observations and so on.
This is beyond the capability of an individual and hence large teams tend to form, bringing together a long term strategy linking researchers, software engineers and experts in high performance computing and high performance data systems. In Australia this is now led by the ACCESS National Research Infrastructure Facility funded by the Federal Government.
Briefing note created by Professor Andy Pitman, Professor Christian Jakob and Professor Andy Hogg.
Reference list and author bios available in the PDF version below.
Climate model stakeholder
How do you choose the right climate model?
What does climate model resolution mean?
