Key takeaways
- The global ocean acts as a buffer for climate change by absorbing heat and carbon dioxide associated with human activities.
- Understanding ocean circulation around Antarctica is critical to understanding global sea level rise.
- Ocean models are a useful tool to study the ocean and to understand how it is changing.
Understanding ocean circulation around Antarctica is critical to understanding global sea level rise and the 3-dimensional circulation of the global ocean.
Unfortunately, observations of this very remote region are limited. Ocean models are therefore a crucial tool to systematically study the ocean around Antarctica.
Why the ocean matters
The ocean stores 97% of the total surface water on the planet and is a big reservoir for heat and carbon.
At the surface, the ocean is in contact with the atmosphere and exchanges heat, freshwater, and gases. During winter in the high latitudes, the ocean freezes at the surface forming sea ice which reflects more light and provides a habitat for species such as algae as well as mammals.
The ocean mitigates anthropogenic climate change by storing almost all (93%) of the additional warming from the greenhouse gas effect over the last 50 years and by absorbing almost a third (30%) of human carbon dioxide emissions.
How we study the ocean – observations and models
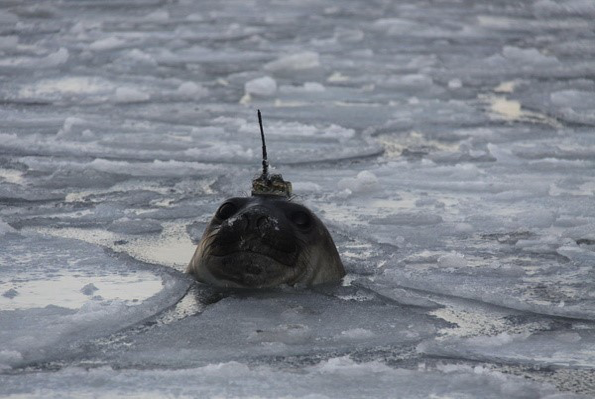
Only about 20% of the seafloor is mapped in detail and much less is known about the water column between the surface and the seafloor. Creative solutions have been found to collect data from various sources including satellites, ships, automatic underwater vehicles (e.g., Argo floats, Figure 2), and even animals which are tagged with sensors (Figure 3).
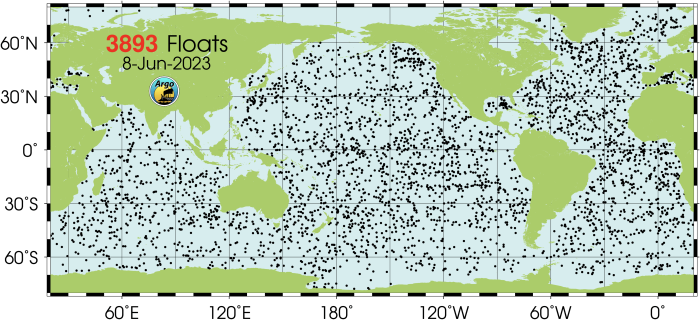
These observations are very valuable as they provide accurate information about the current state of the ocean. However, they generally lack the coverage in space and time to study many physical processes.
In addition, they cannot tell us how the ocean might change in the future. Ocean models can fill this gap.
Ocean models are based on mathematical equations that are solved on supercomputers and thereby simulate the physical state of the ocean.
Models can be used to simulate the past, present, and future condition of the ocean.
The Antarctic Slope Current
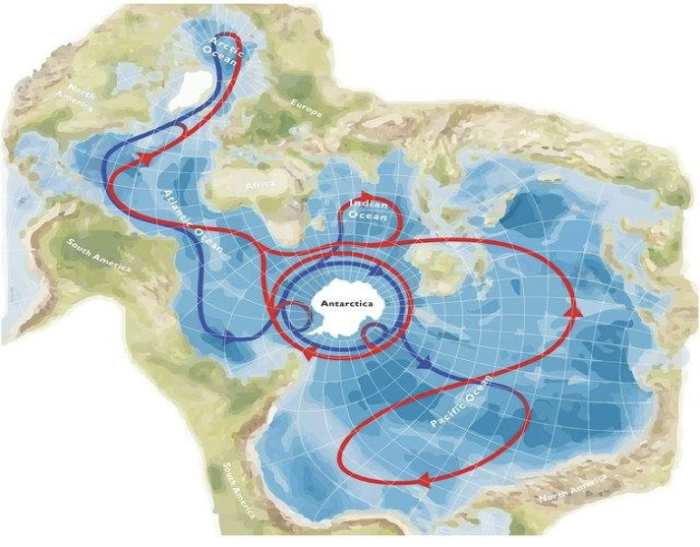
The ocean is constantly in motion and transports heat, salt, and nutrients around the globe.
The redistribution of water helps to regulate the climate and marine ecosystems. Ocean currents are the continuous and directional flow of seawater.
The Antarctic Slope Current is a narrow ocean current that circumnavigates the Antarctic continent.
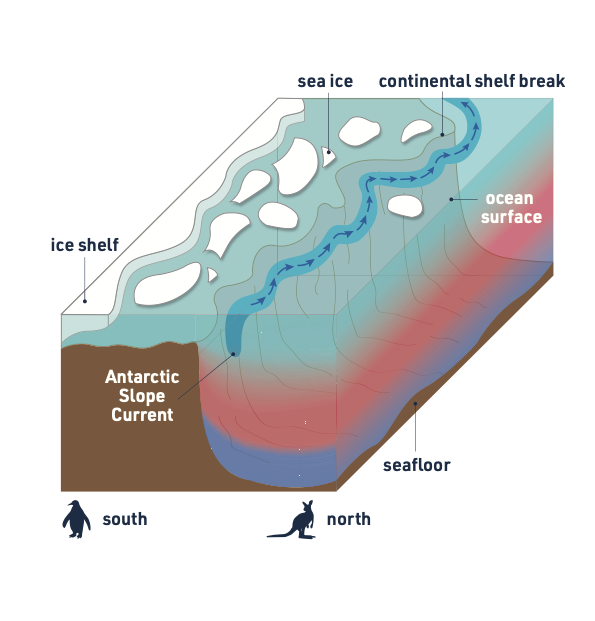
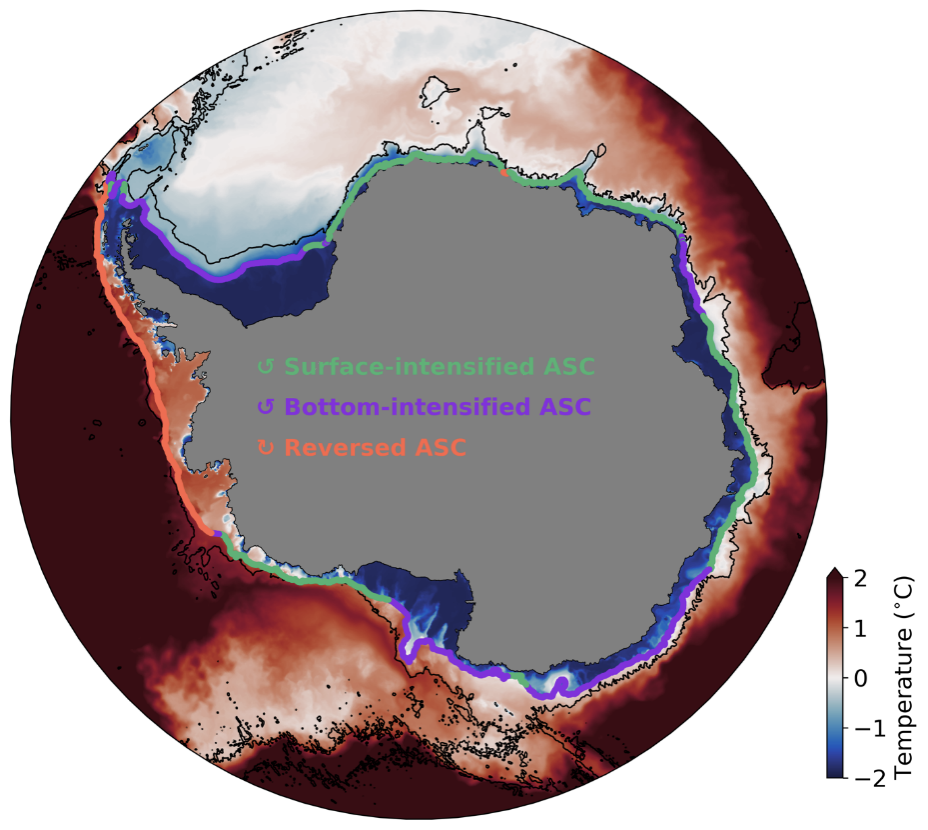
The Antarctic Slope Current follows the steep slope along the edge of the continental shelf (Figure 5). It separates very cold water (below 0°C) on the shallow continental shelf from much warmer water (2°C) in the deep ocean (Figure 5). Any exchange of these very different bodies of water across the Antarctic Slope Current is critical for the global climate.
Movement of the warm water from the deep ocean onto the continental shelf can lead to melting of the Antarctic ice sheet from below.
Melting accelerates the flow of ice from the continent to the ocean and increases the global sea level. In other areas sea ice forms and as the water freezes, the salt stays behind leading to very dense water. This dense water is at the seafloor and sometimes flows down the continental slope, crosses the Antarctic Slope Current, and spreads to all major ocean basins. It can even be found in the Northern Hemisphere.
Using models to study the Antarctic Slope Current
Read this study in full
Huneke, Wilma G. C., Morrison, Adele K., Hogg, Andrew McC., 2022, Spatial and subannual variability of the Antarctic Slope Current in an eddying ocean-sea ice model, 347-361, Journal of Physical Oceanography
The Consortium for Ocean-Sea Ice Modelling in Australia (COSIMA) supports an ocean model called Australian Earth-System Simulator – Ocean Model 2 (ACCESS-OM2). Research conducted with the modelling research program at the ARC Centre of Excellence for Climate Extremes used ACCESS-OM2 to provide a comprehensive description of the Antarctic Slope Current. In this study, different behaviours or regimes of the Antarctic Slope Current are classified (Figure 5). One regime focuses on the export of dense water which is unique to Antarctica (purple in Figure 5).
Ongoing work examines how the presence of this very dense water changes the movement of the Antarctic Slope Current and its effects on the global climate. Model simulations with ACCESS-OM2 show the variability in the dense water over time is reflected in the speed of the Antarctic Slope Current flow at the bottom of the ocean, but not at the surface.
This finding suggests that the surface flow of the Antarctic Slope Current is independent of the deep flow. The finding is important as it tells us that the Antarctic Slope Current is largely insensitive to changes in the formation of dense water. The Antarctic Slope Current can be expected to protect the Antarctic ice sheet from warm ocean waters even if the formation of dense water changes in the future.
This study is an example how models help us to examine and understand how ocean currents behave and how they impact our environment.